| Transition Temperature | 10 K |
|---|---|
| Experiment Temperature | 1.5 K |
| Propagation Vector | k1 (0, 0, 0) |
| Parent Space Group | Pnam (#62) |
| Magnetic Space Group | Pn'a'm' (#62.449) |
| Magnetic Point Group | m'm'm' (8.5.28) |
| Lattice Parameters | 8.72710 4.39760 7.33860 90.00 90.00 90.00 |
|---|---|
| DOI | 10.1103/PhysRevB.108.174412 |
| Reference | R. A. Ewings, M. Reehuis, F. Orlandi, P. Manuel, D. D. Khalyavin, A. S. Gibbs, A. D. Fortes, A. Hoser, A. J. Princep, M. Jansen, PHYSICAL REVIEW B (2023) 108 174412 |
| Label | Element | Mx | My | Mz | |M| |
|---|---|---|---|---|---|
| O1 | O | 0.025 | -0.256 | 0.0 | 0.26 |
Crystal and magnetic structure of cesium superoxide
R. A. Ewings \( ^{©} \) , \( ^{1,*} \) M. Reehuis, \( ^{2} \) F. Orlandi, \( ^{1} \) P. Manuel, \( ^{1} \) D. D. Khalyavin, \( ^{1} \) A. S. Gibbs, \( ^{1,3} \) A. D. Fortes, \( ^{1} \) A. Hoser, \( ^{2} \) A. J. Princep, \( ^{1,4} \) and M. Jansen \( ^{©} \)
\( ^{1} \) ISIS Pulsed Neutron and Muon Source, STFC Rutherford Appleton Laboratory, Harwell Campus, Didcot, Oxon OX11 0QX, United Kingdom
\( ^{2} \) Helmholtz-Center Berlin for Materials and Energy, D-14109 Berlin, Germany
\( ^{3} \) School of Chemistry, University of St. Andrews, North Haugh, St. Andrews, United Kingdom
\( ^{4} \) Department of Physics, University of Oxford, Clarendon Laboratory, Oxford OX1 3PU, United Kingdom
\( ^{5} \) Max-Planck-Institut für Festkörperforschung, D-70569 Stuttgart, Heisenbergstr. 1, Germany
(Received 23 June 2023; revised 22 September 2023; accepted 24 October 2023; published 8 November 2023)
\( CsO_{2} \) is a member of the family of alkali superoxides (formula \( AO_{2} \) with A = Na, K, Rb, and Cs) that exhibit magnetic behavior arising from open p-shell electrons residing on \( O_{2}^{-} \) molecules. We use neutron diffraction to solve the crystal and magnetic structures of \( CsO_{2} \) and observe a complex series of structures on cooling from room temperature to 1.6 K. These include an incommensurate modulation along the a axis of the structure at intermediate temperatures, which then locks into a commensurate modulation that doubles the unit cell compared to the previously supposed orthorhombic unit cell. In both incommensurate and commensurate phases, our structural solution involves a staggering of the cesium ion positions along the b axis, in contrast to studies of other alkali superoxides in which staggered tilts of the \( O_{2}^{-} \) dimers relative to the c axis are seen. Below \( T \simeq 10 \) K, we observe magnetic Bragg reflections arising from an antiferromagnetically ordered structure with a wave vector of k = (0, 0, 0) (relative to the doubled crystallographic unit cell), with moments that point predominantly along the b axis with a small component along the a axis that hints at possible anisotropic exchange coupling (consistent with the crystal structure). Measurements of the magnetic Bragg reflections in an applied magnetic field suggest a spin-flop transition takes place between 2 T and 4 T in which moments likely flop to point along the crystallographic a axis. Our measurements indicate that \( CsO_{2} \) is an interesting example of magnetic properties being inherently linked to the crystal structure, in that the staggered displacement of the cesium ions activates antisymmetric exchange, which then permits the observed spin canting.
DOI: 10.1103/PhysRevB.108.174412
I. INTRODUCTION
The complex interplay between spin, orbital, and lattice degrees of freedom plays a varied role across many material families, resulting in a plethora of emergent properties. Well-known examples include the Jahn-Teller interaction in transition-metal oxides \( [1] \) , magnetoelastic coupling \( [2] \) , and quantum spin liquid states in strongly spin-orbit coupled materials \( [3] \) . This latter example is particularly topical, with the search ongoing for a material showing the bond-directional Ising-like anisotropy necessary for a realization of the Kitaev model, for instance.
Anionogenic magnetic materials are compounds in which the spin degree of freedom is associated with the partially occupied p orbitals of an anionic molecule. Although theoretical predictions exist for other simple anions \( [4] \) , the most well-known experimental examples are for the cases of oxygen anions. Some such materials known to be magnetic include solid oxygen \( [5–7] \) , alkali sesquioxides, and alkali superoxides \( [8] \) . In the latter, the magnetic moment arises due to a partially (half) occupied \( \pi^{*} \) orbital on the \( O_{2}^{-} \) molecular units. Because the magnetic object is spatially extended, on so-called \( O_{2}^{-} \) dumbbells, rather than arising from unpaired electrons on a single ion, a natural coupling arises between the magnetism and the crystal structure. Of particular interest is the interplay of magnetism with the orientation of the dumbbells, a possibility which was noted explicitly in the 1980s and referred to as magnetogyration \( [9] \) . The alkali sesquioxides have attracted much recent attention because they undergo charge ordering, which then leads to the formation of magnetic pyrochlore or dimer lattices \( [10–14] \) .
The alkali superoxides \( AO_{2} \) (A = Na, K, Rb, Cs) have been known for a relatively long time, with studies in the 1970s and 1980s elucidating many of the key physical properties. In particular, the fact that all of them are magnetic and undergo a cascade of structural phase transitions on cooling was recognized at this time [8]. The materials in the family have a common high-temperature structure of the NaCl type [15] in which the \( O_{2}^{-} \) dumbbells are able to rotate freely. As they are cooled, the rotation of the dumbbells progressively becomes hindered, so they precess about the c axis of a tetragonal structure, and then eventually freeze. The details of this freezing are fairly well characterized for \( KO_{2} \) , which forms a monoclinic structure at low temperature in which the dumbbells are frozen at an angle from the higher temperature tetragonal c axis [16,17]. More recently, the crystal structure and magnetism of \( NaO_{2} \) has been studied, and although the
crystal structure is somewhat different to that of \( KO_{2} \) , a common motif is the presence of tilted \( O_{2}^{-} \) dumbbells. Work on \( RbO_{2} \) inferred that its low-temperature structure has quite low symmetry, on the basis of Raman spectroscopy measurements [18], however, the crystal structure was not solved explicitly. Supporting density functional theory (DFT) calculations suggested that, as for \( KO_{2} \) and \( NaO_{2} \) , there would be tilting of the \( O_{2}^{-} \) dumbbells. A study of the structure of oxygen-deficient \( RbO_{2} \) also indicated a preference for tilting the \( O_{2}^{-} \) dumbbells [19].
Neutron diffraction measurements from the 1960s confirmed that \( KO_{2} \) orders antiferromagnetically [17], however, in the data collected at that time only two magnetic Bragg peaks could be discerned above background, making a magnetic structure refinement impossible. On the other hand, the precise details of the crystal and magnetic structures of \( RbO_{2} \) and \( CsO_{2} \) were much less well characterized at that time [15,20]. What was known is that, like \( KO_{2} \) , both materials take on a tetragonal structure at room temperature, with transitions at \( \sim150 \) K into possible orthorhombic structures. Around the same temperature, an incommensurate structure was observed in both materials, with a period around three lattice units along the a axis. Neither the orthorhombic structure nor the incommensurate structure were solved in detail in either case, however.
More recent experimental studies of \( CsO_{2} \) , \( RbO_{2} \) , and \( NaO_{2} \) have revisited their bulk magnetic properties. In particular, \( CsO_{2} \) has been posited to be a pseudo-one-dimensional magnet, with evidence including a broad hump in the magnetic susceptibility reminiscent of what is predicted by a modified Bonner-Fisher model [21]. Magnetic order occurs at \( \sim10 \) K, and DFT calculations of superexchange pathways [18], and NMR [22] and EPR [23] data are consistent with the formation of a Tomonaga-Luttinger liquid phase.
These studies have also revisited the crystal structure, noting the presence of a transition from a tetragonal to an orthorhombic structure below \( \sim70 \) K (a substantially lower temperature than was seen for a similar transition in earlier studies). Notwithstanding, the crystallographic details of the orthorhombic structure were not solved, nor were the details of the magnetic structure. High-field magnetization studies [24] are consistent with \( CsO_{2} \) exhibiting reduced dimensionality, however, these data are not fully consistent with the models proposed in the other studies, and the authors note that in the absence of detailed knowledge of the magnetic structure, all of the data are hard to interpret. Recent studies combining \( \mu \) SR, Raman spectroscopy, and x-ray diffraction on \( RbO_{2} \) [25] and \( NaO_{2} \) [26] have been interpreted similarly, with progressively lowering symmetry on cooling, including the observation of incommensurate structural Bragg peaks in \( RbO_{2} \) . The main difference between the two compounds is that the data on \( RbO_{2} \) are more consistent with a three-dimensional Heisenberg model rather than one-dimensional magnetism, whereas the data on \( NaO_{2} \) suggest that there is low dimensionality and no long range magnetic order.
Application of a relatively modest magnetic field, of \( \sim \) 2.5 T at 2 K, results in a significant change in the magnetic susceptibility of \( CsO_{2} \) [24]. This is interpreted as being a spin flop transition from a low field antiferromagnetic (AFM) state with easy-axis anisotropy. It is notable that the majority of the NMR measurements interpreted as evidence for the formation of a Tomonaga Luttinger liquid were taken at fields either close to or above the spin-flop transition field.
As already discussed, the crystal and magnetic structure of \( KO_{2} \) is better known, and perhaps as a consequence of this there has been more theoretical interest in this member of the superoxide family. Studies have focused on the coupling between spin, orbital, and lattice physics. Several authors have proposed that \( KO_{2} \) undergoes orbital ordering [27–29], which then has consequences for the nature of superexchange between \( O_{2}^{-} \) molecules via the K ion and hence affects the magnetic order that develops. In particular, anisotropic exchange has been discussed [30], which as well as affecting the propensity to magnetic order may also give rise to unusual magnetic excitations. The calculations rely on good knowledge of the crystal structure to have predictive power, underscoring the importance of accurate measurements.
Given the ongoing ambiguity concerning the low-temperature crystal structure of \( CsO_{2} \) , and the ordered magnetic structure, we were motivated to revisit this problem using modern neutron scattering instrumentation and analysis methods. As well as providing a complete picture, such measurements are invaluable for the interpretation of data from other experimental probes as well as informing future theoretical predictions. We found that at low temperature, the crystallographic unit cell is doubled along the a axis compared to the room-temperature tetragonal cell, with a staggered displacement along the b axis of the Cs ions but essentially no tilts of the \( O_{2}^{-} \) dumbbells. This phase sets in below 80 K. We also observed the incommensurate crystal structure, akin to one seen in early studies, and found that like the low-temperature phase it is characterized by an a-axis modulation of the positions of the Cs ions along the b axis. It would seem that this incommensurate structure eventually locks into the aforementioned commensurate one on cooling. The incommensurate phase is visible below 190 K, below which temperature there is a distinct transition from the room-temperature tetragonal phase (space group I4/mmm) to another that, aside from the incommensurate reflections, can be indexed using \( I_{mmm} \) . In the magnetically ordered phase below 10 K, we found that the moments align antiferromagnetically, with the largest component along the b axis but a small component along the a axis also, indicating possible exchange anisotropy.
II. METHODS
The \( CsO_{2} \) powder samples used for this study were prepared using the well-established method of oxidation of distilled Cs metal with dried molecular oxygen [31]. All handling of the starting materials and product was done in an atmosphere of purified argon. In a typical batch, freshly distilled cesium metal (10 g) was placed in a glass tube, connected to a Schlenk line. After evacuating the tube, the metal was melted, and dry, purified oxygen was added in small portions via the Schlenk line. Continuous shaking allowed the metal to stay liquid for a maximum span of time, supporting controlled uptake of oxygen. When no further absorption was noticeable over a period of 1–2 h, the mixture was heated to \( 100^{\circ}C \) and more oxygen was added in small portions. This
procedure was repeated at \( 150^{\circ} \) C and \( 200^{\circ} \) C. The resulting product was ground while cooling (in order to increase brittleness of the raw product) using a brass pestle, subsequently annealed under 1 atmosphere of oxygen at \( 290^{\circ} \) C for two weeks with intermittent grinding, which resulted in a phase pure sample of \( CsO_{2} \) .
Neutron diffraction experiments were conducted using the E2 [32], E6, and E9 [33] diffractometers at the BER-II reactor at the Helmholtz Zentrum Berlin and on the WISH [34] and HRPD [35] diffractometers at the ISIS spallation neutron source.
For the measurements at BER-II, the sample was pressed into cylindrical pellets of diameter 5 mm and height 3 mm, ten of which were placed into a sealed quartz ampoule of diameter 6 mm and height 52 mm. The ampoule was placed into a cylindrical vanadium container of diameter 8 mm and height 60 mm. Experiments on E2 were performed using a fixed incident neutron wavelength of \( \lambda = 2.38 \) Å, selected by a PG monochromator, between temperatures of 1.7 and 100 K in applied magnetic fields between 0 and 6.5 T. The powder grains were confirmed not to have moved in the applied magnetic field on E2 by checking the powder diffraction patterns at zero field before and after field ramps were identical. Experiments on E6 were performed with a fixed incident neutron wavelength \( \lambda = 2.41 \) Å, also selected by a PG monochromator, for temperatures between 1.6 and 248 K in zero applied magnetic field, using the same sample containment as for E2. One data set was collected using E9, with a fixed incident neutron wavelength of \( \lambda = 1.7985 \) Å, selected by a Ge monochromator, at a temperature of 4 K, again with the same sample containment. Neutron powder patterns were collected between the diffraction angles \( 7.8^{\circ} \) to \( 83.4^{\circ} \) (E2), \( 5.5^{\circ} \) to \( 136.4^{\circ} \) (E6), and \( 7.5^{\circ} \) to \( 141.7^{\circ} \) (E9), respectively.
HRPD and WISH are both time of flight (ToF) instruments, with a white beam of neutrons incident on the sample and analysis of the arrival time at the detectors (ToF) used to determine wavelength and hence Bragg reflection d spacing. For the experiments on WISH, the sample, in fine powder form, was loaded into an aluminum can with an annular geometry, with height 40 mm, outer diameter 20 mm, and sample thickness 2 mm. The sample was loaded in a helium glovebox and the can, which was completely filled, sealed with indium wire. The sample was first cooled to 1.6 K, then a measurement of 40 min duration was performed at 1.6 K, followed by another of the same duration at 25 K. The sample was then recooled to 1.6 K and further measurements were made at fixed temperatures for 5 min per temperature, warming back up to 300 K. A sample temperature fluctuation of \( \leqslant 2\% \) was observed for each of the measurements. For crystal structure analysis, data time-focused onto the higher angle detector banks at \( 2\theta = 152.9^{\circ} \) and \( 2\theta = 121.7^{\circ} \) were used. For the magnetic refinements, the lower angle detector bank data at \( 2\theta = 58.3^{\circ} \) was used.
On HRPD, as for the measurements on WISH, the sample loading was done in a helium glovebox to avoid reaction of the sample with air. In this case, it was placed directly into an 8-mm-diameter vanadium can of height 40 mm, filling up to a depth of 24 mm (the same sample volume as for WISH). The beam height on HRPD is 20 mm, so the entire sample was illuminated by the neutron beam. Measurements were

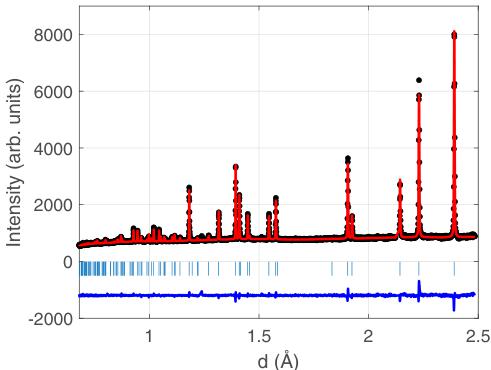
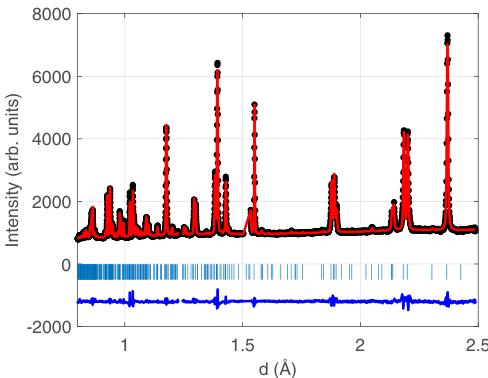
FIG. 1. Data collected at 290 K on HRPD as a function of d spacing, refined using the 14/mmm space group (see text). Measured data are indicated by black circles, the fit by the red line, and the difference curve (offset by -1200 units) is shown as a blue curve. Vertical ticks indicate the positions of Bragg reflections. The residuals for these fits were \( R_{p} = 2.18 \) and \( R_{wp} = 2.88 \) .
performed over fixed time intervals (6 min) as the sample was cooled from 290 K. Longer measurements were then taken at 20 K (8 h) and 80 K (3 h). All of the data used for subsequent analysis were collected in the highest angle detector bank, with data time-focused to a scattering angle of \( 2\theta = 168.33^{\circ} \) .
Structural refinements were performed using the FULLPROF software suite \( [36,37] \) for the E2, E6, and E9 data and using JANA2006 \( [38] \) for the HRPD and WISH structural data. Subsequent magnetic refinements were performed using FULLPROF for the WISH data. Magnetic symmetry analysis for the magnetic structure refinement was done using the Basirreps tool implemented in FULLPROF. The incommensurate structure analysis was done using Jana2006 together with ISODISTORT software \( [39,40] \) .
III. RESULTS
A. Crystal structure
Figure 1 shows data collected at 290 K (room temperature) on the HRPD instrument, together with a refinement with the 14/mmm space group and lattice parameters widely reported in the literature. A satisfactory refinement can be achieved for these data collected for a relatively short duration (6 min) with correspondingly nonoptimized signal to noise.
The details of the crystal structure determined at 290 K are given in Table I. Refinements of the data from WISH at the same temperature are consistent with these parameters.
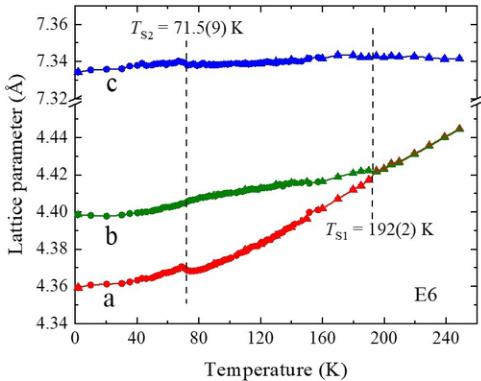
On cooling, a phase transition is observed at \( T_{S1} = 192(2) \) K that appears to be tetragonal to orthorhombic, as illustrated in Fig. 2, which shows the lattice parameter as a function of temperature determined from Rietveld refinements using the tetragonal 14/mmm space group above the transition and the orthorhombic Immm space group below it, from data collected on E6. The latter space group represents the symmetry of the lattice if only macroscopic strain is taken
TABLE I. Crystal structure parameters for the 14/mmm space group solution at 290 K measured on the HRPD instrument. The determined lattice parameters were \( a = 4.4589(2) \) Å and \( c = 7.3320(3) \) Å. The unit cell volume was \( V = 145.796(1) \) Å \( ^{3} \) . The residuals for the fit were \( R_{p} = 2.18\% \) and \( R_{wp} = 2.88\% \) .
| Atom | Site | x | y | z | U_{iso}( \( \textup{\AA}^{2} \) ) |
| Cs | 2a | 0.00 | 0.00 | 0.00 | 0.0323(6) |
| O | 4e | 0.00 | 0.00 | 0.4138(1) | 0.0404(5) |
into account [39,40]. The strain reflects the change of the unit cell metric below the transition and therefore this space group is sufficient to evaluate the thermal evolution of the unit cell parameters. The transition is at a temperature consistent with early structural studies of \( CsO_{2} \) [15], but significantly higher than observed in more recent x-ray diffraction experiments [18]. To get good fits, we found that anisotropic displacement parameters (ADPs) were required. The best fits were obtained with considerable elongation of the ADP ellipsoids of the cesium ions along the b axis compared to the other principal axes. Furthermore, the ADP ellipsoids of the oxygen ions were elongated in the ab plane, albeit with a smaller difference between a and b than for the cesium ions, and compressed significantly along the c axis. These findings suggest the presence of atomic displacements not accounted for in the Immm space group.
Close examination of the data collected on WISH shows that at temperatures above \( \sim72 \) K, and at least up to 180 K, weak incommensurate superlattice reflections are visible above the background that can be indexed using a propagation vector of \( \mathbf{k}_{\mathrm{IC}} = (0.561(2), 0, 0) \) referenced to the tetragonal unit cell, i.e., a period of 1.78 lattice units. The intensity of the strongest incommensurate peaks is about 1% of the strongest commensurate nuclear Bragg peak visible in Figs. 1 and 6 at \( d = 2.37 \) Å. The incommensurate peaks were just detectable above the background in the HRPD data in an 8 h

FIG. 2. Temperature dependence of lattice parameters refined from E6 data, assuming 14/mmm and Immm space groups at high and low temperature, respectively.

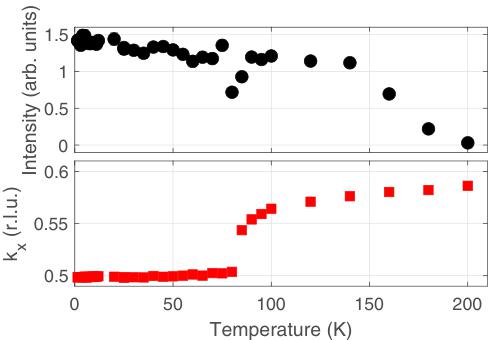
FIG. 3. Data from WISH showing the disappearance on warming up to 200 K of the incommensurate Bragg reflection at \( Q_{IC} = (1.56, 2, 1) \) at d = 1.69 Å. The upper panel shows the intensity of the peak, determined by integrating a fitted Gaussian, with black circles. The lower panel shows the fitted position of peak \( k_{x} \) with respect to \( (1 + k_{x}, 2, 1) \) with red squares. In both cases, the error bars are smaller than the point size.
measurement, but visible in measurements of 5 min duration on WISH. The reason for this is the featureless but nonzero incoherent background signal from the vanadium sample can be used on HRPD vs the much lower incoherent background (albeit interspersed with strong nuclear Bragg peaks) from the aluminum sample can be used on WISH.
The appearance of the incommensurate superlattice seems to be concomitant with the putative transition from the tetragonal to orthorhombic structure at \( T_{S1} \) . To probe this further, we show in Fig. 3 the temperature dependence of the intensity and position of the \( (1 + k_{x}, 2, 1) \) peak (the fact that superlattice peaks such as this one appear at short d spacing, and hence large \( |Q| \) , indicates that they are structural rather than magnetic in origin).
Given that the incommensurate reflections seem to appear at the same temperature as the putative tetragonal to orthorhombic transition, to solve the structural modulation we assumed that the corresponding order parameter is transformed by a single irreducible representation (irrep) of the high-temperature tetragonal space group \( I4/mmm \) . The irreducible nature of the order parameter was concluded based on the continuous character of the transition evidenced by the temperature dependence of the unit cell parameters (Fig. 2). There are four irreps, \( \Sigma_{i}(i=1-4) \) associated with the \( (g,0,0) \) line of symmetry. The relevant superspace groups were generated by ISODISTORT [39,40] and compared with the available diffraction data. Some of them could be ruled out due to extinction conditions that predict no intensity where a finite signal was observed (e.g., at \( d=4.05\ \AA \) ). The remainder were tested using JANA2006 software. The best agreement (with \( R_{wp}=8.83\% \) ) was found for the model with \( Immm(0,0,g)s00 \) symmetry yielded by the \( \Sigma_{4} \) irrep and illustrated in Fig. 4. The largest displacements are of the cesium ions, which are staggered along the b axis following a sinusoidal modulation with an amplitude of 0.0564(9) lattice units. The oxygen molecules also exhibit a sinusoidal displacement.

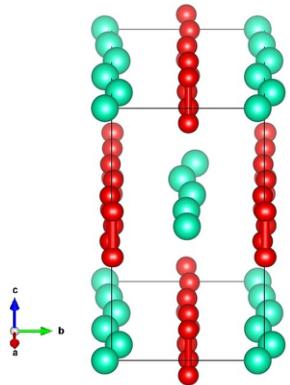
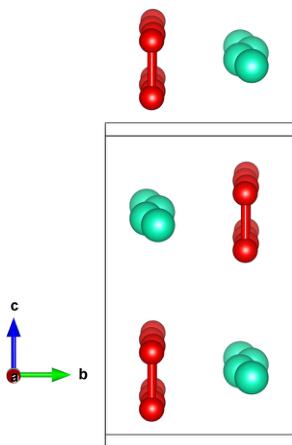
FIG. 4. Representation of the incommensurate crystal structure determined using the refined WISH data at 100 K. The Cs ions (green spheres) and oxygen dumbbells (red spheres connected by red cylinder to indicate the molecular bond) modulate sinusoidally along the a axis, with displacements along the b axis (in tetragonal notation, which is cyclically permuted with respect to the notation in Table II). Five unit cells along a are shown to illustrate the form of the displacements. This image, and others in the rest of the paper illustrating crystal and magnetic structures, were rendered using VESTA software [41].
along b, albeit with a smaller amplitude of 0.0090(7) lattice units. Interestingly, this symmetry does not permit the rotation of oxygen molecules widely predicted for \( CsO_{2} \) , and seen in other alkali superoxides, whereas some of the other irreps
TABLE II. Structural parameters of \( CsO_{2} \) obtained from refinement of the neutron diffraction data ( \( T=100~K \) ) using the \( Immm(0,0,g)s00 \) superspace group with the basis vectors related to the parent tetragonal \( I4/mmm \) structure as \( (0,-1,0,0),(0,0,1,0),(-1,0,0,0),(0,0,0,1) \) with the origin at \( (0,0,0,\frac{3}{4}) \) . Here, \( A_{i}^{1} \) and \( B_{i}^{1} \) with \( i=(x,y,z) \) are the Fourier coefficients of the first harmonic \( (n=1) \) of the displacive modulation function, \( u_{i,j,l}(r_{j,l},\mathbf{k}_{\mathrm{IC}})=\sum_{n=0}^{\infty}A_{i,j}^{r}\sin(2\pi n[\mathbf{r}_{j,l}\cdot\mathbf{k}_{\mathrm{IC}}]+B_{i,j}^{r}\cos(2\pi n[\mathbf{r}_{j,l}\cdot\mathbf{k}_{\mathrm{IC}}]) \) , where \( r_{j,l} \) indicates the position of the jth atom of the average structure in the lth unit cell. The unit cell parameters are \( a=4.4117(1)\mathring{\mathrm{A}} \) , \( b=7.3438(2)\mathring{\mathrm{A}} \) , \( c=4.3762(1)\mathring{\mathrm{A}} \) , and \( \mathbf{k}_{\mathrm{IC}}=(0,0,0.561(2)) \) , the latter adopted for the setting of the superspace group specified above. The unit cell volume is \( V=141.782(6)\mathring{\mathrm{A}}^{3} \) . The residuals for the fit are \( R_{p}=6.86\% \) and \( R_{wp}=8.83\% \) .
| Atom | x | y | z | U_{\text{iso}}(\text{\AA}^{2}) |
| A_{i}^{1} | A_{x}^{1} | A_{y}^{1} | A_{z}^{1} | |
| B_{i}^{1} | B_{x}^{1} | B_{y}^{1} | B_{z}^{1} | |
| Cs | 0.0 | 0.0 | 0.0 | 0.0029(5) |
| -0.0564(9) | 0.0 | 0.0 | ||
| 0.0 | 0.0 | 0.0 | ||
| O | 0.0 | 0.40964(12) | 0.0 | 0.0110(3) |
| -0.0090(7) | 0.0 | 0.0 | ||
| -0.0 | 0.0 | 0.0 |

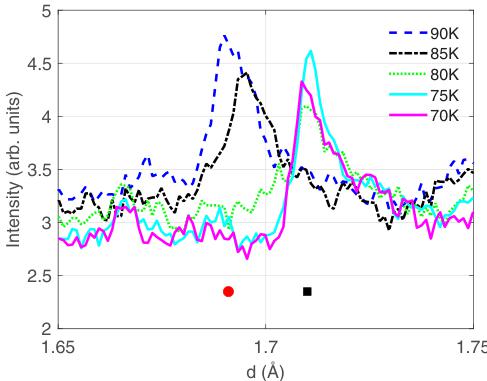
FIG. 5. Data from WISH showing the transition from incommensurate to commensurate crystal structure. Below \( \sim80 \) K, a peak corresponding to \( \mathbf{Q}_{\mathrm{C}} = (\frac{3}{2}, 2, 1) \) appears at d = 1.71 Å. At higher temperatures, a peak corresponding to \( \mathbf{Q}_{\mathrm{IC}} = (1.57, 2, 1) \) at d = 1.69 Å is visible. Commensurate and incommensurate peak positions are indicated by a black square and a red circle, respectively.
(that agreed less well with the data) do. Rather, in the \( \Sigma_{4} \) irrep, the entire molecules' centers of mass are displaced along b, with the molecules remaining oriented parallel to the c axis. The complete structural solution for the incommensurate phase is given in Table II.
On further cooling, a significant anomaly in the a lattice parameter (in the Immm setting) and a smaller anomaly in the c parameter, occurs at \( T_{S2} = 71.5(9) \) K. At the same time, the propagation vector of the incommensurate structural modulation changes and locks in to a commensurate value of \( \mathbf{k}_{\mathrm{C}} = (\frac{1}{2}, 0, 0) \) (again referred to the Immm cell), which survives down to the lowest temperatures measured. Data showing the transition locking into \( \mathbf{Q}_{\mathrm{C}} = (\frac{3}{2}, 2) = (1, 2, 1) + \mathbf{k}_{\mathrm{C}} \) are shown in Fig. 5.
To understand what is happening crystallographically in this phase, we performed careful Rietveld refinements of all of the data collected on the different instruments used. In previous work, it was suggested that the orthorhombic space group Immm provides an appropriate description of the crystal structure. However, that would be inconsistent with the doubled unit cell seen below \( T_{S2} \) .
Assuming the most likely scenario, that the low-temperature structural transition is a lock-in type, one can deduce the possible symmetries of the crystal structure below \( T_{S2} \) . This scenario sets symmetry constraints on the transformational properties of the commensurate order parameter, impaling the same active irrep for both incommensurate and commensurate phases. As mentioned above, the modulated orthorhombic structure is associated with \( \Sigma_{4} \) . This irrep is four-dimensional, with the components of the complex order parameter \( (\eta_{1}, \eta_{1}^{*}, \eta_{2}^{*}, \eta_{2}) \) . Using the matrix operators summarized in Table III, one can verify the existence of a lock-in free-energy invariant, \( \eta_{1}^{4} + \eta_{1}^{*4} + \eta_{2}^{*4} + \eta_{2}^{4} \) , for the commensurate value of the propagation vector \( \mathbf{k}_{\mathrm{C}} = (1/2, 0, 0) \) . This energy term exists only for the single value of the propagation
TABLE III. Matrices of irreducible representations for generators of 14/mmm space group, associated with the \(\mathbf{k} = (1, 1, 1)\) (\(M\) point) and the \(\mathbf{k} = (1/2, 0, 0)\), \((-1/2, 0, 0)\), \((0, -1/2, 0)\), \((0, 1/2, 0)\) wave vector star (\(\Sigma\) line of symmetry) [42]. Note that here \(T\) is the time-reversal operator.
| Symmetry | mM5+(δ1, δ2) | mΣ3(ξ1, ξ1*, ξ2*, ξ2) | Σ4(η1, η1*, η2*, η2) |
| {1|0, 0, 0} | (1 0) | (1 0 0 0) | (1 0 0 0) |
| (0 1 0 0) | (0 1 0 0) | ||
| (0 0 1 0) | (0 0 1 0) | ||
| (0 0 0 1) | (0 0 0 1) | ||
| {2z|0, 0, 0} | (-1 0) | (-1 0 0 0) | (0 1 0 0) |
| {2y|0, 0, 0} | (0 1) | (-1 0 0 0) | (1 0 0 0) (1 0 0 0) |
| (0 0 0 0) | (0 0 0 0) | ||
| (0 0 0 0 |
vector and therefore its activation favors the commensurate phase. This symmetry argument further supports the lock-in mechanism for the transition at \( T_{S2} \) .
In the commensurate limit of \( k_{C} = (1/2, 0, 0) \) , there are three isotropy subgroups associated with \( \Sigma_{4} \) . Depending on the choice of the global phase of the modulation, one can obtain the Pnma, Pmma, and Pmc2 \( _{1} \) subgroups. They were the primary candidates in the refinement of the low-temperature diffraction data. Independent analysis based on testing of all possible isotropy subgroups of I4/mmm consistent with the doubled unit cell also resulted only in two possibilities, Pnma and Pmc2 \( _{1} \) . We performed refinements of all data collected on HRPD (since it had the highest resolution) at 20 K using Pnam and found generally satisfactory fits, with \( R_{p} = 2.51\% \) and \( R_{wp} = 3.33\% \) . We also investigated refining the data with the Pna2 \( _{1} \) space group (No. 33), which is a subgroup of Pnam, and found slightly improved residuals of \( R_{p} = 2.47\% \) and \( R_{wp} = 3.29\% \) . However, given that the improvement in goodness of fit was very small and likely arises due to fewer symmetry constraints on the structure, we take the higher symmetry structure to be the solution. The final refinements using the Pnam space group are shown in Fig. 6.

FIG. 6. Data and refinement using Pnam for data collected on HRPD at 20 K as a function of d spacing. Black circles indicate the measured data, the red line the refinement, and the blue line indicates the difference between the two (offset by -2000 units). Vertical ticks indicate the positions of Bragg reflections.
The details of the refinements using the Pnam space group is given in Table IV, and shown graphically in Fig. 7. The most notable feature is that the Cs ions are shifted considerably from their ideal position of \( \frac{3}{4} \) on the b axis, and form a zigzag pattern in the doubled unit cell along a. In the Pnam structure, the oxygen dumbbells are not allowed by symmetry to tilt, whereas they are, in principle, free to do this in the Pna2 \( _{1} \) structure that was investigated. In the former structural solution, we found that there was a small staggered shift of the center of mass of the oxygen dumbbells along the b axis, albeit of much smaller magnitude than the shift of the Cs ions. For the Pna2 \( _{1} \) structure (see Table V), this shift of the oxygen dumbbells was found to be of the same nature, i.e., there was essentially no tilt of the oxygen dumbbells even when this would be allowed by symmetry.
B. Magnetic structure
On cooling below \( T \approx 10~K \) , additional low Q/long d-spacing peaks appear that are consistent with the previously supposed appearance of AFM order. Such peaks were consistently visible in the data collected on WISH, E2, E6, and E9. As mentioned in Sec. II, only the WISH data were used for refining the magnetic structure. Of all the data sets, those
TABLE IV. Crystal structure parameters for the Pnam space group solution at 20 K measured on the HRPD instrument. The determined lattice parameters were \( a = 8.7271(1)\mathring{\mathrm{A}} \) , \( b = 4.39758(6)\mathring{\mathrm{A}} \) , and \( c = 7.33860(8)\mathring{\mathrm{A}} \) . The unit cell volume was \( V = 281.640(6)\mathring{\mathrm{A}}^{3} \) . The residuals for the fit were \( R_{p} = 2.51\% \) and \( R_{wp} = 3.33\% \) .
| Atom | Site | x | y | z | U_{\text{iso}}(\text{\AA}^{2}) |
| Cs | 4c | 0.1207(4) | 0.7142(4) | 0.25 | 0.0022(4) |
| O | 8d | 0.8747(4) | 0.2472(4) | 0.15944(8) | 0.0082(3) |

FIG. 7. The refined crystal structure with the Pnam space group, with oxygen molecules shown in red (spheres connected by a cylinder to indicate the molecular bond) and cesium ions shown in green (spheres only). The unit cell is indicated by the gray box. The view shown is slightly tilted from being parallel to the a axis. The periodic displacements of the Cs ions are clear, with a smaller but still visible periodic displacement of the \( O_{2}^{-} \) molecules also. The figure shows two unit cells along the a axis.
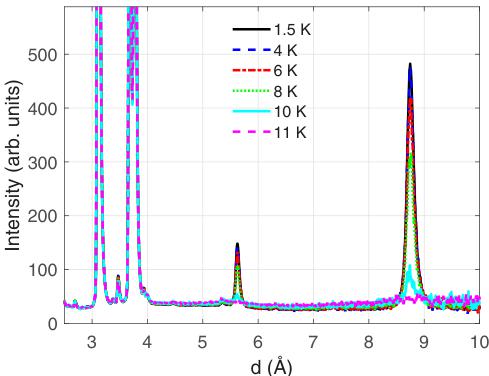
from this instrument had the best signal to noise ratio and hence the most magnetic Bragg peaks were discernible, giving the greatest chance of a reliable refinement of the magnetic structure. Subsequent checks of the refinement using the E2, E6, and E9 instruments yielded good fits. An overview of the data collected as a function of temperature below 11 K is shown in Fig. 8.
The appearance of strong peaks at \( (1,0,0) \) and \( (1,0,1) \) indicates the onset of AFM order at \( 10 < T_{N} < 11 \) K. This compares with the peaks in the inverse susceptibility and specific heat, that are taken to give the value of \( T_{N} \) , of 9.6 K [19,43,44]. The small difference may be due to small differences in thermometry or a slight lag on the true sample temperature since the measurements were collected on warming.
All possible irreducible representations of a magnetic structure with \( \mathbf{k}=(0,0,0) \) in the Pnam space group are
TABLE V. Crystal structure parameters for the Pna2 \( _{1} \) space group solution, at 20 K measured on the HRPD instrument. The determined lattice parameters were \( a=8.727(3)\mathring{\mathrm{A}} \) , \( b=4.3968(2)\mathring{\mathrm{A}} \) , \( c=7.3380(2)\mathring{\mathrm{A}} \) . The unit cell volume was \( V=281.553(3)\mathring{\mathrm{A}}^{3} \) . The residuals for the fit were \( P_{p}=2.47\% \) and \( R_{wp}=3.30\% \) , which represent a very small improvement compared to the refinement shown in Table IV for the Pnam crystal structure.
| Atom | Site | x | \( y \) | z | \( U_{\text{iso}}(\text{\AA}^{2}) \) |
| Cs | 4a | 0.1203(3) | 0.7816(9) | -0.0003(4) | 0.0043(4) |
| O1 | 4a | 0.1277(4) | 0.7502(12) | 0.4091(14) | 0.0066(3) |
| O2 | 4a | 0.6293(4) | 0.7575(8) | -0.4091(12) | 0.0091(5) |

FIG. 8. Overview of the data collected in the low angle bank on WISH as a function of temperature between 1.5 K and 11 K. Data have been converted from time of flight to d spacing. The strong peaks at \( \sim \) 8.8 Å and \( \sim \) 5.7 Å correspond to the (1,0,0) and (1,0,1) Bragg reflections, respectively.
given in Table VI. The general expressions of the Fourier coefficients \( \mathbf{S}_{\mathbf{k}}(j) \) were obtained from the basis functions calculated from the different representations of the \( O_{2}^{-} \) units at the Wyckoff position 4c of space group Pnam: O1 at \( (x, y, \frac{1}{4}) \) , O2 at \( (-x, -y, \frac{3}{4}) \) , O3 at \( (\frac{1}{2} + x, \frac{1}{2} - y, \frac{1}{4}) \) , and O4 at \( (\frac{1}{2} - x, \frac{1}{2} + y, \frac{3}{4}) \) . Instead of Wyckoff position 8d, where the individual oxygen atoms are located, we used 4c, which defines the center of gravity of the \( O_{2}^{-} \) unit.
We also considered a solution to the magnetic structure using the lower symmetry space group \( Pna2_{1} \) . The difference between the magnetic structures allowed in the two space groups is that Pnam does not permit magnetic order with a general component of the moment in the ab plane and along the c axis, but one or the other. On the other hand, \( Pna2_{1} \) does, in principle, allow magnetic moments to point along a general direction. However, we found that even refining the c-axis component of the magnetic moment, permitted in \( Pna2_{1} \) , we found the best fit yielded this component as zero within the error bar. For the following, we therefore restrict our discussion just to Pnam.
TABLE VI. Irreducible representations of a \(\mathbf{k} = (0, 0, 0)\) magnetic structure in the Pnam space group.
| Irrep | \( \mathbf{S}_{\mathbf{k}}(1) \) | \( \mathbf{S}_{\mathbf{k}}(2) \) | \( \mathbf{S}_{\mathbf{k}}(3) \) | \( \mathbf{S}_{\mathbf{k}}(4) \) |
| \( \Gamma_{1}(4c) \) | \( (0, 0, u) \) | \( (0, 0, u) \) | \( (0 0, -u) \) | \( (0 0, -u) \) |
| \( \Gamma_{2}(4c) \) | \( (u, v, 0) \) | \( (-u, -v, 0) \) | \( (u, -v, 0) \) | \( (-u, v, 0) \) |
| \( \Gamma_{3}(4c) \) | \( (0, 0, u) \) | $ (0, 0, u) | �MATH228� | �MATH229� |
| �MATH230� | �MATH231� | $ (-u, -v, 0) | \( (-u, v, 0) \) | \( (u, -v, 0) \) |
| \( \Gamma_{5}(4c) \) | \( (u, v, 0) \) | \) (u, v, 0) | \( (u, -v, 0) \) | \( (u, -v, 00) \) |
| \( \Gamma_{6}(4c) \) | \( (0, 0, u) \) | \) (0, 0, -u) | \( (0 0, -u) \) | \( (0 0 0, u) \) |
| \( \Gamma_{7}(4c) \) | \( (u, v, 0) \) | \() (u, v, 0) | \) (-u, v, 0) | \( (-u, v, 0) \) |
| \( \Gamma_{\mathbf{8}}(4c) \) | \( (0, 0, u) \) | \( \)(0, 0, -u) | \( \)(0, 0, u) | \( \)(0, 0, -u) |

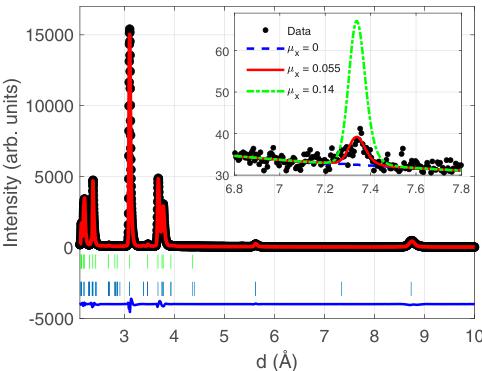
FIG. 9. Data collected in the low angle bank on WISH at 1.5 K (black points), together with the final refinement (solid red line) and difference curve (solid blue line). The lower ticks (blue) are for the AFM structure and the upper ticks (green) are for the nuclear structure. The inset shows data focused on the region where the \( (0,0,1) \) peak is to be found. The lines correspond to simulations of the scattering with different values of \( \mu_{x} \) , with all other parameters from the refinement fixed. This shows that the intensity of the \( (0,0,1) \) peak is rather sensitive to the value of \( \mu_{x} \) .
Note that the magnetic form factor for the \( s = 1/2 O_{2}^{-} \) ions was included using the tabulated values obtained from measurements of solid oxygen [45]. Although the size of the oxygen molecules is different (1.29 Å for solid oxygen vs 1.33 Å for \( CsO_{2} \) ), the difference is small enough that we have reasonable confidence that the derived form factor is applicable here.
Before fitting the data, we note that the strong intensity at \( (1,0,0) \) and \( (1,0,1) \) implies that the largest component of the magnetic moment will be along the b axis, since the magnetic neutron diffraction cross section is proportional to the component of the magnetic moment perpendicular to the wave vector. This means that we can immediately rule out the \( \Gamma_{1} \) , \( \Gamma_{3} \) , \( \Gamma_{6} \) , and \( \Gamma_{8} \) irreps, since they contain moments parallel to the c axis only.
We also note that for the \( \Gamma_{7} \) irrep, the y components of the moments are coupled ferromagnetically. Since the bulk susceptibility follows a purely AFM trend below \( T_{N} \) , for the refinements this component must be fixed to zero, which immediately allows us to rule it out. This then leaves the following possible irreps: \( \Gamma_{2} \) , \( \Gamma_{4} \) , and \( \Gamma_{5} \) , which all have AFM arrangements of spins for the major y component of the moment.
The presence of a very weak peak corresponding to \( (0,0,1) \) , that appears below \( T_{N} \) and hence must be magnetic, also allows us to narrow down our choice of possible irreps. This observation allows us to rule out \( \Gamma_{5} \) , for which this peak has zero intensity. Comparing \( \Gamma_{2} \) and \( \Gamma_{4} \) , we found substantially better fits ( \( R_{wp} = 6.36\% \) ) for the case of the \( \Gamma_{2} \) irrep compared to the \( \Gamma_{4} \) irrep ( \( R_{wp} = 7.75\% \) ). The best fit was found with \( \mu_{y} = 0.512(16)\mu_{B} \) and \( \mu_{x} = 0.05(2)\mu_{B} \) , giving a total moment of \( 0.514\mu_{B} \) . As illustrated in the inset of Fig. 9, the

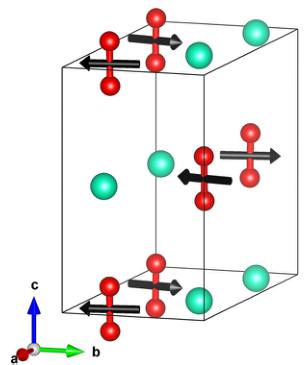
FIG. 10. The refined magnetic structure of \( CsO_{2} \) , with black arrows indicating the moment direction on the \( O_{2}^{-} \) dumbbells, the oxygen ions shown as red spheres, connected by a red cylinder to indicate the molecular bond, and the Cs ions are shown as green spheres.
presence of the \( (0,0,1) \) peak is crucial for determining the x component of the magnetic moment, as the intensity is rather sensitive to the value of \( \mu_{x} \) . The final refinement is shown in Fig. 9, together with an inset showing the sensitivity of the \( (0,0,1) \) peak's intensity to \( \mu_{x} \) . The final refined magnetic structure is shown in Fig. 10. Our result implies the magnetic structure has \( Pn^{\prime}a^{\prime}m^{\prime} \) symmetry, keeping the setting of the paramagnetic Pn \( _{am} \) space group.
C. Spin-flop transition
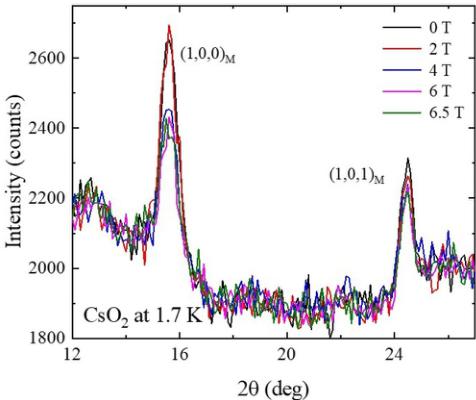
Data taken on the E2 diffractometer probed the effect of an applied magnetic field on the two strongest magnetic Bragg peaks, \( (1,0,0) \) and \( (1,0,1) \) , and are shown in Fig. 11. Both peaks showed marked decreases in intensity between 2 T and 4 T. The strong \( (1,0,0) \) peak intensity reduces in magnitude above the background by approximately one-third, with a somewhat smaller reduction of around 15% seen for the \( (1,0,1) \) peak. In the zero-field phase, we have established that the moments lie predominantly along the b axis, and in a spin-flop transition we would expect them to switch to being parallel to the a or c directions. Crucially, this would apply only to those (randomly oriented) crystallites in the powder sample whose b axes lie mostly parallel to the applied magnetic field. Above the critical field, we would therefore expect approximately one-third of the crystallites to undergo a spin-flop transition. The maximum change in magnetic Bragg peak intensity would therefore be \( \frac{1}{3} \) , corresponding to the signal from one-third of the crystallites involved in the spin flop going to zero. Because the \( (1,0,0) \) peak reduces by approximately this amount, we can surmise that the spin flop involves spins reorienting from the b axis to the a axis. If the spins were to flop towards c, and assuming no change in the size of the ordered moment, then the component of magnetization perpendicular to Q would be unchanged, and hence no change in the intensity of the \( (1,0,0) \) Bragg peak would be seen, at variance with our observations. On the other

FIG. 11. Data collected on E2 at \(T = 1.7\) K in applied magnetic fields between 0 T and 6.5 T. A sharp drop in peak intensity of the (1,0,0) and (1,0,1) magnetic Bragg reflections is observed for \(2 < B < 4\) T, most likely arising from a spin-flop transition.
hand, a spin flop towards a would result in the component of magnetization perpendicular to Q going to zero. We can check this result by looking at the intensity of the \( (1,0,1) \) magnetic Bragg peak as well. Spins reorienting from b to a would result in a reduction in Bragg peak intensity of \( \sim40\% \) for one-third of the crystallites involved, giving rise to an overall reduction in intensity of \( \sim13\% \) , which is broadly consistent with what we observe.
IV. DISCUSSION AND CONCLUSION
We have determined the low-temperature crystal structure of \( CsO_{2} \) , finding it to be described by the orthorhombic space group Pnam (or equally well by the lower symmetry orthorhombic space group \( Pna2_{1} \) ) in which the a axis is approximately double the length of the b axis. Earlier work indicated a lowering of symmetry on cooling from room temperature, for example, via the appearance of extra peaks in the Raman spectrum that could not be accounted for in a high-symmetry setting [18] or due to the observation of the weak \( \left(\frac{1}{2},0,0\right) \) peaks (indexed in the high temperature tetragonal unit cell) at low temperature in x-ray diffraction measurements [15]. Furthermore, DFT calculations have predicted an enlarged (doubled) unit cell compared to the high-temperature tetragonal phase [18]. However, we note neither that the Raman nor the x-ray data were used to determine the detailed crystal structure as we have here. In addition, the DFT calculations were correct in predicting a doubled unit cell, but suggested that the doubling occurs along more than one crystallographic axis, which we did not observe.
Concerning the details of the low-temperature crystal structure we determined, we see that the doubling of the unit cell along a is predominantly due to a zigzag displacement (puckering) of the Cs ions, with a smaller zigzag displacement of the centers of mass of the \( O_{2}^{-} \) dumbbells. The staggered displacement of Cs ions was foreseen by DFT [18]. On the
other hand, the same DFT also predicted a tilting relative to the c axis of the \( O_{2}^{-} \) dumbbells, a scenario with which our data are inconsistent. It is interesting to contrast this result with structures determined for other members of the \( AO_{2} \) family, particularly \( KO_{2} \) and \( NaO_{2} \) , for which low-temperature crystal structures have been solved. In those cases, a common motif is the tilting of the \( O_{2}^{-} \) dumbbells away from the nominal tetragonal c axis, a motif not supported by our analysis.
Looking at the refined low-temperature commensurate structure, we can compare it to the incommensurate structure visible for \( 80 \simeq T \simeq 200 \) K by looking at the amplitude of the displacement of the Cs ions and \( O_{2}^{-} \) dumbbells, respectively. The amplitude of the sinusoidal modulation of Cs ion positions in the incommensurate phase was 0.0564(9) lattice units, whereas the amplitude of the modulation, given by the deviation of the Cs ion position along the b axis relative to the ideal coordinate of y = 0.75 in the commensurate phase, is 0.0358(1) lattice units. These values are rather comparable. The amplitude of the \( O_{2}^{-} \) dumbbell displacement was 0.0090(7) lattice units in the incommensurate phase, whereas in the commensurate phase it is 0.0028(4) lattice, which is somewhat different.
We see in Fig. 2 that cooling below the transition from a tetragonal phase at \( T_{S1} = 192 \) K, the a lattice parameter of the average structure shrinks significantly more rapidly down to \( T_{S2} = 71.5 \) K, reducing by \( \sim1.2\% \) compared to the b lattice parameter which reduces by just 0.34% and the c lattice parameter which barely changes ( \( <0.1\% \) change). At \( T_{S2} \) , the a lattice parameter (when indexed using the Immm space group) suddenly increases. A possible explanation for this is that the puckering of the Cs ions in the incommensurate structure at comparatively high temperature, when the oxygen molecules' orientation is fluctuating significantly, results in strain on the lattice due to underbonding. As the fluctuations decrease on cooling, eventually the Cs ions and oxygen molecules can bond, leading to a lock-in to the commensurate structure, a decrease in lattice strain, and a corresponding slight increase in a.
It was already noted that a staggered structure would likely have an impact on the strength of the superexchange interaction between the s = 1/2 units due to differing orbital overlap between the oxygens and the cesium ions [22]. NMR data modeled under the assumption of staggered tilts of the \( O_{2}^{-} \) dumbbells indicated the formation of AFM 1D spin chains in \( CsO_{2} \) . The temperature dependence of the magnetic exchange parameters determined from the NMR was understood in relation to the assumed staggered dumbbell tilts together with a model-based changing orbital overlap as a result of librations of the dumbbells. Our findings show that, in fact, the dumbbells are hardly tilted at all, rather the cesium ion positions are staggered. One might anticipate that the overall effect could be similar, at least as far as superexchange is concerned. It would be interesting to remodel the NMR data based on the crystal structure we have determined.
We note that there is some discussion in the literature of orbital ordering in superoxides \( [22,23,27–29] \) , which has an impact on the aforementioned spin-chain formation. Orbital order is frequently accompanied by structural distortion, as in the cooperative Jahn-Teller effect \( [46] \) . In the tetragonal I4/mmm structure of \( CsO_{2} \) , one can take the \( 2b(0,0,1/2) \) Wyckoff position with the 4/mmm site symmetry as the place where the \( O_{2}^{-} \) molecules reside. The degenerate \( \pi^{*} \) molecular orbitals of \( O_{2}^{-} \) form the basis of the two-dimensional \( E_{u} \) site symmetry irrep, which has nonzero subduction frequency in the \( \Sigma_{4} \) space group irrep. This implies that local distortions that belong to the site symmetry irrep \( E_{u} \) can induce global distortions that belong to the space group irrep \( \Sigma_{4} \) . In other words, the structural distortions obtained in the present paper are compatible with the orbital ordering scenario. The ground-state orthorhombic structure is consistent with the orbital pattern proposed by Riyadi et al. \( [18] \) although no additional doubling along the b and c axes suggested by the authors, due to tilting of the oxygen dimers, was detected in our diffraction data. The incommensurate phase implies partial occupancies of the \( \pi_{x}^{*} \) and \( \pi_{y}^{*} \) orbitals, modulated upon propagation through the crystal (i.e., an orbital density wave). A similar phenomenon takes place in some perovskite manganites containing octahedrally coordinated \( Mn^{3+} \) cations with electronic degeneracy. The modulated orbital states in these systems vary from achiral density waves \( [47] \) to chiral orbital helices \( [48] \) .
Now considering the magnetic structure, we have confirmed that, as long anticipated, \( CsO_{2} \) is an antiferromagnet. We note that until now the details of the magnetic structure had remained unknown, with the only proposal being that of ferromagnetism within the ab plane with an AFM stacking between planes [43], which was formed on the basis of analogy with \( KO_{2} \) [17] rather than a direct measurement. So, our data clarify this point at last, revealing ferromagnetism in the bc plane and antiferromagnetism along a. The total magnetic moment determined, \( 0.514\mu_{B} \) , is reduced compared to the ideal spin-only value, possibly due to fluctuations and/or reduced dimensionality [22].
The presence of a small component of the magnetic moment along the a axis, as well as the larger component along b, is significant. These orthogonal spin components are transformed by the same irrep of the paramagnetic Pnma space group (Table VI), implying bilinear coupling between them. This is a typical case of antisymmetric Dzyaloshinskii-Moriya (DM) exchange underpinning the coupling at the microscopic level [49]. Let us denote the corresponding magnetic order parameters as \( \delta \) and \( \xi \) , respectively. The bilinear invariant, \( \delta\xi \) , in principle, also involves single ion terms, however, these are not relevant here due to the S=1/2 nature of the interacting spins. The \( \delta \) and \( \xi \) order parameters are transformed by distinct irreps ( \( mM_{5}^{+} \) and \( m\Sigma_{3} \) ) of the tetragonal I4/mmm space group (Table III), indicating that they would be decoupled if no structural distortion was present. Decomposition of the experimentally determined ground-state crystal structure of \( CsO_{2} \) with respect to symmetrised displacive modes of the tetragonal I4/mmm reveals the presence of \( \Gamma_{1}^{+}(k=0) \) , \( \Gamma_{2}^{+}(k=0) \) , \( M_{5}^{-}(k=1,1,1) \) , and \( \Sigma_{4}(k=1/2,0,0) \) modes. The latter has the largest amplitude (of 0.25 Å), as expected for the primary order parameter. Further analysis of the allowed free-energy terms reveals that the \( \Sigma_{4}(\eta_{1},\eta_{1}^{*},\eta_{2}^{*},\eta_{2}) \) order parameter forms a trilinear invariant with \( mM_{5}^{+}(\delta_{1},\delta_{2}) \) and \( m\Sigma_{3}(\xi_{1},\xi_{1}^{*},\xi_{2}^{*},\xi_{2}) \) .
\[ \begin{aligned}\delta_{1}\eta_{1}\xi_{1}^{*}+\delta_{1}\eta_{1}^{*}\xi_{1}-\delta_{1}\eta_{2}\xi_{2}^{*}-\delta_{1}\eta_{2}^{*}\xi_{2}\\-\delta_{2}\eta_{1}\xi_{1}^{*}-\delta_{2}\eta_{1}^{*}\xi_{1}-\delta_{2}\eta_{2}\xi_{2}^{*}-\delta_{2}\eta_{2}^{*}\xi_{2},\end{aligned} \]
indicating that this structural distortion is responsible for the coupling of the orthogonal magnetic modes in the ground-state orthorhombic structure. The term is reduced down to \( \delta_{1}\eta_{1}\xi_{1}^{*}+\delta_{1}\eta_{1}^{*}\xi_{1}-\delta_{2}\eta_{1}\xi_{1}^{*}-\delta_{2}\eta_{1}^{*}\xi_{1} \) for the case of a single arm of the \( \Sigma \) star, as observed experimentally. The coupling is fully optimized when the \( mM_{5}^{+}(\delta_{1},\delta_{2}) \) order parameter takes the \( \delta_{1}=-\delta_{2} \) direction \( (\delta_{1},-\delta_{2}) \) . This direction represents the symmetry of the experimentally observed secondary AFM mode with the components of the spins along the orthorhombic a axis.
Although one might expect the spin-orbit coupling coefficient to be small for superoxide molecules \( [50] \) , the fact that the distortion of the Cs ions is large means that the DM interaction mediated via superexchange may not be. Indeed, the effect of a DM interaction in \( NaO_{2} \) has been studied explicitly in a combined first-principles/model Hamiltonian study \( [51] \) , where its effect on the magnetism was found to be significant. Although the details of the crystal structure of \( NaO_{2} \) and \( CsO_{2} \) are somewhat different, it is reasonable to suppose that similar physics may be at play, providing a microscopic justification for what we have found via our symmetry analysis.
In conclusion, we have used neutron diffraction to perform a comprehensive study of the crystal and magnetic structure of \( CsO_{2} \) . We find that an incommensurate crystal structure appears seemingly simultaneously with a transition from a tetragonal to an orthorhombic structure at 192 K. This incommensurate structure, which is modulated along a, is composed of displacements of the cesium ions along the b axis and of smaller displacements of the \( O_{2}^{-} \) dimers' entire center of mass. On cooling further below 72 K, the modulated structure locks into a commensurate wave vector of \( \left(\frac{1}{2}, 0, 0\right) \) , doubling the unit cell compared to the previously supposed orthorhombic crystal structure. Hints of a structure bearing some similarity to this had previously been suggested from DFT calculations. However, in both calculations and in other superoxides, it was found that the \( O_{2}^{-} \) dimers tilt with respect to the c axis, which is different to what is seen here. Magnetic order sets in below
[1] S. Blundell, Magnetism in Condensed Matter (Oxford University Press, Oxford, 2001).
[2] E. R. Callen and H. B. Callen, Static magnetoelastic coupling in cubic crystals, Phys. Rev. 129, 578 (1963).
[3] J. G. Rau, E. K.-H. Lee, and H.-Y. Kee, Spin-orbit physics giving rise to novel phases in correlated systems: Iridates and related materials, Annu. Rev. Condens. Matter Phys. 7, 195 (2016).
[4] O. Volnianska and P. Boguslawski, Magnetism of solids resulting from spin polarization of p orbitals, J. Phys.: Condens. Matter 22, 073202 (2010).
[5] P. W. Stephens and C. F. Majkrzak, Magnetic structure and dynamics in the alpha and \( \beta \) phases of solid oxygen, Phys. Rev. B 33, 1 (1986).
[6] F. Fernandez-Alonso, F. J. Bermejo, I. Bustinduy, M. A. Adams, and J. W. Taylor, Spin dynamics in liquid and rotationally disordered solid oxygen, Phys. Rev. B 78, 104303 (2008).
~10 K and, as previously supposed, this order is AFM. The spins of the \( O_{2}^{-} \) dimers modulate along the a axis and point predominantly along b, albeit with a small component along a. Thus, \( CsO_{2} \) is an interesting example of a structure-properties relationship. The large structural distortion, associated with the staggered cesium and oxygen displacements, activates antisymmetric exchange and couples the orthogonal magnetic modes directly observed in the neutron diffraction experiment. For applied magnetic field \( 2 < B < 4 \) T, we see changes in magnetic Bragg peak intensity that are consistent with a spin-flop transition in which the magnetic moments reorient to point along the a axis.
Note added: Recently, we became aware of another work, Ref. [52], in which neutron powder diffraction was used to examine the magnetic structure of \( CsO_{2} \) . The authors also discussed the structural aspects of the order. The main difference to the present work compared to Ref. [52] is in how the structural distortions are combined with the magnetic order. Taking the tetragonal 14/mmm space group as the common parent symmetry, the suggested structural distortions and the magnetic order double the a and b axes, respectively. In the ground state found in our paper, both the primary structural distortions and the spin ordering double the same tetragonal axis (the a axis in our setting). In addition, the measurements presented in Ref. [52] were insensitive to the small a-axis component of the magnetic moment that we found.
Raw data are available online [53–55].
ACKNOWLEDGMENTS
We are grateful to B. Lake and R. Ono for insightful discussions. Experiments at the ISIS Neutron and Muon Source were supported by an Xpress beamtime allocation RB1990392 from the Science and Technology Facilities Council.
[7] S. Klotz, T. Strässle, A. L. Cornelius, J. Philippe, and T. Hansen, Magnetic ordering in solid oxygen up to room temperature, Phys. Rev. Lett. 104, 115501 (2010).
[8] W. Hesse, M. Jansen, and W. Schnick, Recent results in solid state chemistry of ionic ozonides, hyperoxides, and peroxides, Prog. Solid State Chem. 19, 47 (1989).
[9] M. A. Bosch, M. E. Lines, and M. Labhart, Magnetoelastic interactions in ionic \( \pi \) -electron systems magnetogyration Phys. Rev. Lett. 45, 140 (1980).
[10] J. Winterlik, G. H. Fecher, C. A. Jenkins, C. Felser, C. Mühle, K. Doll, M. Jansen, L. M. Sandratskii, and J. Kübler, Challenge of magnetism in strongly correlated open-shell 2p systems, Phys. Rev. Lett. 102, 016401 (2009).
[11] D. Arçon, K. Anderle, M. Klanjšek, A. Sans, C. Mühle, P. Adler, W. Schnelle, M. Jansen, and C. Felser, Influence of \( O_{2} \) molecular orientation on p-orbital ordering and exchange pathways in \( Cs_{4}O_{6} \) , Phys. Rev. B 88, 224409 (2013).
[12] P. Adler, P. Jeglič, M. Reehuis, M. Geiß, P. Merz, T. Knaflič, M. Komelj, A. Hoser, A. Sans, J. Janek, D. Arčon, M. Jansen, and C. Felser, Verwey-type charge ordering transition in an open-shell p-electron compound, Sci. Adv. 4, eaap7581 (2018).
[13] R. H. Colman, H. E. Okur, W. Kockelmann, C. M. Brown, A. Sans, C. Felser, M. Jansen, and K. Prassides, Elusive valence transition in mixed-valence sesquioxide \( Cs_{4}O_{6} \) , Inorg. Chem. 58, 14532 (2019).
[14] T. Knaflič, P. Jeglič, M. Komelj, A. Zorko, P. K. Biswas, A. N. Ponomaryov, S. A. Zvyagin, M. Reehuis, A. Hoser, M. Geiss, J. Janek, P. Adler, C. Felser, M. Jansen, and D. Arčon, Spin-dimer ground state driven by consecutive charge and orbital ordering transitions in the anionic mixed-valence compound \( Rb_{4}O_{6} \) , Phys. Rev. B 101, 024419 (2020).
[15] M. Ziegler, M. Rosenfeld, W. Kanzig, and P. Fischer, Strukturuntersuchungen an Alkalihyperoxiden [Structural investigations of alkali hyperoxides], Helv. Phys. Acta 49, 57 (1976).
[16] F. Halverson, Comments on potassium superoxide structure, J. Phys. Chem. Solids 23, 207 (1962).
[17] H. G. Smith, R. M. Nicklow, L. J. Raubenheimer, and M. K. Wilkinson, Antiferromagnetism in potassium superoxide \( KO_{2} \) , J. Appl. Phys. 37, 1047 (1966).
[18] S. Riyadi, B. Zhang, R. A. de Groot, A. Caretta, P. H. M. van Loosdrecht, T. T. M. Palstra, and G. R. Blake, Antiferromagnetic \( S = 1/2 \) spin chain driven by p-orbital ordering in \( CsO_{2} \) , Phys. Rev. Lett. 108, 217206 (2012).
[19] S. Riyadi, S. Giriyapura, R. A. D. Groot, A. Caretta, P. H. V. Loosdrecht, T. T. Palstra, and G. R. Blake, Ferromagnetic order from p-electrons in rubidium oxide, Chem. Mater. 23, 1578 (2011).
[20] M. Rosenfeld, M. Ziegler, and W. Kanzig, Helv. Phys. Acta 51, 298 (1978).
[21] J. C. Bonner and M. E. Fisher, Linear magnetic chains with anisotropic coupling, Phys. Rev. 135, A640 (1964).
[22] M. Klanjšek, D. Arčon, A. Sans, P. Adler, M. Jansen, and C. Felser, Phonon-modulated magnetic interactions and spin Tomonaga-Luttinger liquid in the p-orbital antiferromagnet \( CsO_{2} \) , Phys. Rev. Lett. 115, 057205 (2015).
[23] T. Knaflič, M. Klanjšek, A. Sans, P. Adler, M. Jansen, C. Felser, and D. Arčon, One-dimensional quantum antiferromagnetism in the p-orbital \( CsO_{2} \) compound revealed by electron paramagnetic resonance, Phys. Rev. B 91, 174419 (2015).
[24] M. Miyajima, F. Astuti, T. Kakuto, A. Matsuo, D. P. Sari, R. Asih, K. Okunishi, T. Nakano, Y. Nozue, K. Kindo, I. Watanabe, and T. Kambe, Magnetism and high-magnetic field magnetization in alkali superoxide \( CsO_{2} \) , J. Phys. Soc. Jpn. 87, 063704 (2018).
[25] F. Astuti, M. Miyajima, T. Fukuda, M. Kodani, T. Nakano, T. Kambe, and I. Watanabe, Anionogenic magnetism combined with lattice symmetry in alkali-metal superoxide \( RbO_{2} \) , J. Phys. Soc. Jpn. 88, 043701 (2019).
[26] M. Miyajima, F. Astuti, T. Fukuda, M. Kodani, S. Iida, S. Asai, A. Matsuo, T. Masuda, K. Kindo, T. Hasegawa, T. C. Kobayashi, T. Nakano, I. Watanabe, and T. Kambe, Spin-gap formation due to spin-Peierls instability in \( \pi \) -orbital-ordered \( NaO_{2} \) , Phys. Rev. B 104, L140402 (2021).
[27] A. K. Nandy, P. Mahadevan, P. Sen, and D. D. Sarma, \( KO_{2} \) : Realization of orbital ordering in a p-orbital system, Phys. Rev. Lett. 105, 056403 (2010).
[28] M. Kim, B. H. Kim, H. C. Choi, and B. I. Min, Antiferromagnetic and structural transitions in the superoxide \( KO_{2} \) from first principles: A 2p-electron system with spin-orbital-lattice coupling, Phys. Rev. B 81, 100409(R) (2010).
[29] M. Kim and B. I. Min, Temperature-dependent orbital physics in a spin-orbital-lattice-coupled 2p electron Mott system: The case of \( KO_{2} \) , Phys. Rev. B 89, 121106(R) (2014).
[30] I. V. Solovyev, Spin-orbital superexchange physics emerging from interacting oxygen molecules in \( KO_{2} \) , New J. Phys. 10, 013035 (2008).
[31] A. Helms and W. Klemm, The crystal structures of Rubidium and cesium oxide, Z. Anorg. Allg. Chem. 242, 33 (1939).
[32] J. U. Hoffmann and M. Reehuis, E2: The flat-cone diffractometer at BER II, JLSRF 4, A129 (2018).
[33] D. Többens, N. Stüsser, K. Knorr, H. Mayer, and G. Lampert, E9: The new high-resolution neutron powder diffractometer at the Berlin neutron scattering center, Mater. Sci. Forum 378-381, 288 (2001).
[34] L. C. Chapon, P. Manuel, P. G. Radaelli, C. Benson, L. Perrott, S. Ansell, N. J. Rhodes, D. Raspino, D. Duxbury, E. Spill, and J. Norris, Wish: The new powder and single crystal magnetic diffractometer on the second target station, Neutron News 22, 22 (2011).
[35] R. M. Ibberson, Design and performance of the new supermirror guide on HRPD at ISIS, Nucl. Instrum. Methods Phys. Res., Sect. A 600, 47 (2009).
[36] J. Rodríguez-Carvajal, Recent developments of the program FULLPROF, Commission on powder diffraction (IUCr). Newsletter 26, 12 (2001).
[37] J. Rodríguez-Carvajal, Recent advances in magnetic structure determination by neutron powder diffraction, Phys. B: Condens. Matter 192, 55 (1993).
[38] V. Petříček, M. Dušek, and L. Palatinus, Crystallographic Computing System JANA2006: General features, Z. Kristallogr. Cryst. Mater. 229, 345 (2014).
[39] ISODISTORT, ISOTROPY Software Suite, https://iso.byu.edu, accessed Oct. 11, 2022.
[40] B. J. Campbell, H. T. Stokes, D. E. Tanner, and D. M. Hatch, ISODISPLACE: A web-based tool for exploring structural distortions, J. Appl. Crystallogr. 39, 607 (2006).
[41] K. Momma and F. Izumi, VESTA3 for three-dimensional visualization of crystal, volumetric and morphology data, J. Appl. Crystallogr. 44, 1272 (2011).
[42] M. I. Aroyo, A. Kirov, C. Capillas, J. M. Perez-Mato, and H. Wondratschek, Bilbao Crystallographic Server. II. Representations of crystallographic point groups and space groups, Acta Cryst. A 62, 115 (2006).
[43] M. Labhart, D. Raoux, W. Kanzig, and M. A. Bosch, Magnetic order in 2p-electron systems: Electron paramagnetic resonance and antiferromagnetic resonance in the alkali hyperoxides \( KO_{2} \) , \( RbO_{2} \) , and \( CsO_{2} \) , Phys. Rev. B 20, 53 (1979).
[44] A. Zumsteg, Eigenschaften von Alkali-Hyperoxid-Kristallen [Magnetic and caloric properties of alkali hyperoxide crystals], Ph.D. thesis, ETH Zürich, 1973.
[45] P. W. Stephens, Magnetic form factor of the \( O_{2} \) molecule, Phys. Rev. B 31, 4491 (1985).
[46] J. Kanamori, Crystal distortion in magnetic compounds, J. Appl. Phys. 31, S14 (1960).
[47] N. Perks, R. Johnson, C. Martin, L. Chapon, and P. Radaelli, Magneto-orbital helices as a route to coupling magnetism and
ferroelectricity in multiferroic \( CaMn_{7}O_{12} \) Nat. Commun. 3, 1277 (2012).
[48] D. D. Khalyavin, R. D. Johnson, F. Orlandi, P. G. Radaelli, P. Manuel, and A. A. Belik, Emergent helical texture of electric dipoles, Science 369, 680 (2020).
[49] I. Dzyaloshinsky, A thermodynamic theory of “weak” ferromagnetism of antiferromagnetics, J. Phys. Chem. Solids 4, 241 (1958).
[50] W. C. Martin, Table of spin-orbit energies for p-electrons in neutral atomic (core) np configurations, J. Res. Natl. Bur. Stand., Sect. A 75, 109 (1971).
[51] I. V. Solovyev, Z. V. Pchelkina, and V. V. Mazurenko, Magnetism of sodium superoxide, CrystEngComm 16, 522 (2014).
[52] T. Nakano, S. Kontani, M. Hiraishi, K. Mita, M. Miyajima, and T. Kambe, Antiferromagnetic structure with strongly reduced ordered moment of p-electron in \( CsO_{2} \) , J. Phys.: Condens. Matter 35, 435801 (2023).
[53] R. A. Ewings, A. S. Gibbs, and A. D. Fortes, The structure of \( CsO_{2} \) , STFC ISIS Neutron and Muon Source, 2020, doi:10.5286/ISIS.E.RB1990392.
[54] R. A. Ewings, P. Manuel, D. D. Khalyavin, and F. Orlandi, CAL_WISH_Cs2O2 cooling from 200K in OC09 HRSF, STFC ISIS Neutron and Muon Source, 2016, doi:10.5286/ISIS.E.RB0-15505.
[55] R. A. Ewings, M. Reehuis, and A. Hoser, CsO2 HZB data, 2023, doi:10.5281/zenodo.8369572.
 p3_0.jpg
 p4_0.jpg
 p4_1.jpg
 p5_0.jpg
 p5_1.jpg
 p7_0.jpg
 p7_1.jpg
 p8_0.jpg
 p8_1.jpg
 p9_0.jpg
 p9_1.jpg