| Transition Temperature | 15.1 K |
|---|---|
| Experiment Temperature | 1.5 K |
| Propagation Vector | k1 (0, 0, 0) |
| Parent Space Group | P63/mmc (#194) |
| Magnetic Space Group | Cmc'm' (#63.463) |
| Magnetic Point Group | m'm'm (8.4.27) |
| Lattice Parameters | 4.3936 7.8815 4.3936 90.0000 120.000 90.0000 |
|---|---|
| DOI | 10.1016/j.jmmm.2022.169147 |
| Reference | S. Shin, V. Pomjakushin, M. Bartkowiak, M. Medarde, T. Shang, D.J. Gawryluk, E. Pomjakushina, J. Magn. Magn. Mater. (2022) 551 169147 |
| Label | Element | Mx | My | Mz | |M| |
|---|---|---|---|---|---|
| Ce1 | Ce | 0.0 | 0.0 | 1.16 | 1.16 |
Journal of Magnetism and Magnetic Materials
journal homepage: www.elsevier.com/locate/jmmm
Cu-doping effects on the ferromagnetic semimetal CeAuGe

Soohyeon Shin \( ^{a,*} \) , Vladimir Pomjakushin \( ^{b} \) , Marek Bartkowiak \( ^{c} \) , Marisa Medarde \( ^{a} \) , Tian Shang \( ^{d,a} \) , Dariusz J. Gawryluk \( ^{a} \) , Ekaterina Pomjakushina \( ^{a,*} \)
\( ^{a} \) Laboratory for Multiscale Materials Experiments, Paul Scherrer Institut, CH-5232 Villigen PSI, Switzerland
\( ^{b} \) Laboratory for Neutron Scattering and Imaging, Paul Scherrer Institut, CH-5232, Villigen PSI, Switzerland
\( ^{c} \) Laboratory for Neutron and Muon Instrumentation, Paul Scherrer Institut, CH-5232 Villigen PSI, Switzerland
\( ^{d} \) Key Laboratory of Polar Materials and Devices (MOE), School of Physics and Electronic Science, East China Normal University, Shanghai 200241, China
ARTICLE INFO
Keywords: CeAuGe CeCuGe Intermetallics Ferromagnetism Kondo effects Cu-doping Magnetic structure Shubnikov magnetic space group
A B S T R A C T
We present a study of Cu-substitution effects in 4f-Ce intermetallic compound \( CeAu_{1-x}Cu_xGe \) , with potentially unusual electronic states, in the whole concentration range \( (x = 0.0 - 1.0) \) . The parent \( CeAuGe \) compound, crystallizing in a non-centrosymmetric hexagonal structure, is a ferromagnetic semimetal with Curie temperature 10 K. Cu-doping on Au-site of \( CeAuGe \) , \( CeAu_{1-x}Cu_xGe \) , changes the crystal structure from the non-centrosymmetric \( (P6_{3}/mmc) \) to centrosymmetric \( (P6_{3}/mmc) \) space group at the concentration \( x \sim 0.5 \) , where the c-lattice constant has a maximum value. Magnetic susceptibility and electrical resistivity measurements reveal that all Cu-doped compounds undergo magnetic phase transition near 10 K, with the maximum transition temperature of 12 K for \( x = 0.5 \) . The neutron powder diffraction experiments show the ferromagnetic ordering of \( Ce^{3+} \) magnetic moments with a value of about \( 1.2 \mu_{B} \) at 1.8 K, oriented perpendicular to the hexagonal c-axis. By using symmetry analysis, we have found the solutions for the magnetic structure in the ferromagnetic Shubnikov space groups \( Cmc'2_{1}' \) and \( P2_{1}'/m' \) for \( x < 0.5 \) and \( x \geq 0.5 \) , respectively. Electrical resistivity \( \rho(T) \) exhibits a metallic temperature behaviour in all compositions. The resistivity \( \rho(T) \) has a local minimum in the paramagnetic state due to Kondo effects at high doping \( x = 0.8 \) and 1.0. At the small Cu-doping level, \( x = 0.2 \) , the resistivity shows a broad feature at the ferromagnetic transition temperature and an additional transition-like peculiarity at 2.5 K in the ferromagnetic state.
1. Introduction
Ce-based intermetallic compounds, in which localized moments of \( Ce^{3+} \) ion form Kondo lattice, exhibit exotic quantum phenomena such as heavy-fermion superconductivity [1-3], topological magnetism [4], intriguing magnetic ordering [5,6], and quantum phase transition [7,8]. The ground states of the Ce-based metals are controlled by competing interactions between the spin anisotropy, multiple exchange interactions, and Kondo hybridization. The Kondo hybridization between localized Ce moment and itinerant spins can be tuned by non-thermal parameters such as pressure, magnetic field, and chemical doping. Chemical doping modifies the density of states at the Fermi level, whereby exchange interactions between localized and itinerant spin change the ground state of the system as described in the Doniach phase diagram [9].
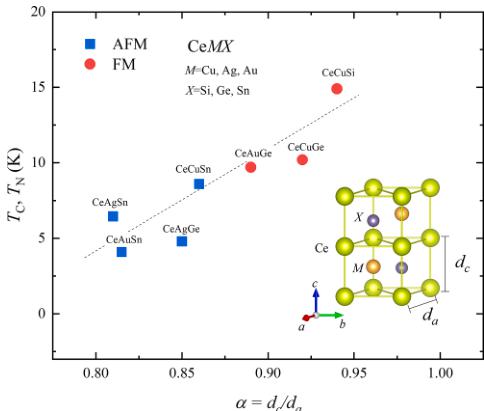
Table 1 summarizes Ce-based hexagonal compounds of CeMX (M = Cu, Ag, Au, and X = Si, Ge, Sn). All systems exhibit magnetically ordered states. Fig. 1 shows a linear relation between transition temperatures of magnetic ordering ( \( T_{C} \) , \( T_{N} \) ) and an anisotropic parameter \( a = d_{c}/d_{a} \) , when \( d_{a} \) and \( d_{c} \) are Ce-Ce distance along the crystallographic a- and c-axis, respectively. When the magnetic exchange interactions between Ce-spins are anisotropic, \( 0.80 < \alpha < 0.875 \) , the magnetic ground state is antiferromagnetic (AFM) one, while isotropic interactions, \( 0.875 < \alpha < 0.95 \) , favour a ferromagnetic (FM) ordering. As shown in Table 1, all CeMX compounds have similar crystalline-electric-field ground states ( \( GS_{CEF} \) ) of mainly \( |\pm1/2\rangle \) with mixing of \( |\mp5/2\rangle \) doublet.
An unusual non-collinear FM structure has been reported in CeAlSi, presumably due to the non-centrosymmetric crystal structure [20]. In our case, both non-centrosymmetric end member CeAuGe and the centrosymmetric one CeCuGe exhibit ferromagnetism with transition temperature near 10 K. This is in accordance with a previous neutron powder diffraction study that has shown that the magnetic ordering in CeAuGe is a collinear FM, and we note that the magnetic structure of CeCuGe has not been reported [21]. Cu-doping of the non-
centrosymmetric CeAuGe is the way of investigating the relationship between the magnetic ordering, crystal symmetry, and the bulk physical properties, while the Curie temperature remains similar. Herein, we report the crystal and magnetic structures of the polycrystalline series of \( CeAu_{1-x}Cu_xGe \) using x-ray and neutron diffraction and the macroscopic physical properties such as electrical resistivity and magnetization as a function of temperature and magnetic field.
2. Material and methods
Polycrystalline samples of \( CeAu_{1-x}Cu_xGe \) were synthesized by the arc-melting technique, and then the arc-melted samples were sealed in the evacuated silica tubes with a Ta-foil, then the tubes were quenched in the cold water after annealed at 800 °C for 10 days to improve the homogeneity of the samples. Phase purity and crystal structures of \( CeAu_{1-x}Cu_xGe \) were checked by powder x-ray diffraction measurements (PXRD) using a Bruker D8 Advance with Cu-cathode. Chemical composition was confirmed by x-ray micro-fluorescence (XRF) analysis using an Orbis micro-XRF analyzer from EDAX. The crystal and magnetic structures were studied by neutron powder diffraction using the high-resolution powder diffractometer for thermal neutrons (HRPT) [22] at the Swiss Spallation Neutron Source SINQ at Paul Scherrer Institut (PSI), Switzerland. About 2.5 g of each powder was loaded in 6 mm vanadium containers. Diffraction patterns were collected at temperatures of 1.5 and 15 K using neutrons with wavelengths of 1.494 and 2.45 Å. All diffraction data were analyzed using the programs of the FullProf software suite [23]. The symmetry analysis of the magnetic structures was done using the Bilbao crystallographic server [24] and the ISODISTORT tool based on ISOTROPY software [25,26]. Electrical resistivity measurements were performed using the standard four-probe (25 μm Pt wires) technique applying a current of 1 mA on the polished surface of bar-shaped specimens. A physical property measurement system (PPMS-9, Quantum Design) was used for applying magnetic fields up to 90 kOe and controlling the temperature in the range from 1.8 to 300 K. A \( {}^{3}He \) -pumping system with an Oxford vertical magnet cryostat was adopted for the resistivity measurements in the temperature range from 0.28 to 2 K. The magnetization measurements were performed on a superconducting quantum interference device (SQUID) installed in the magnetic property measurement system (MPMS-7, Quantum Design), in the temperature and magnetic field ranges from 1.8 to 300 K and 0 to 70 kOe, respectively.
3. Results
3.1. Crystal structure of \( CeAu_{1-x}Cu_xGe \)
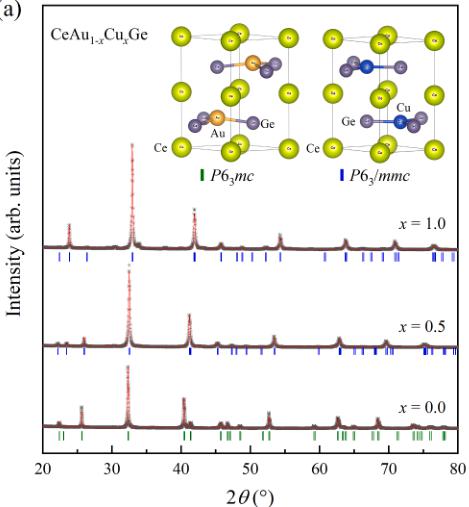
Fig. 2(a) shows crystal structures of CeAuGe and CeCuGe and representative PXRD patterns for \( CeAu_{1-x}Cu_xGe \) (x = 0.0, 0.5, 1.0). Both end-member compounds adopt hexagonal structure, wherein the two different hexagonal layers of Ce – Ce and M – Ge (M = Cu and Au) stack alternately along the crystallographic c-axis. While the puckered

Fig. 1. Magnetic ordering temperatures \( T_{C} \) , \( T_{N} \) of CeMX (M = Cu, Ag, Au, and X = Si, Ge, Sn) as a function of anisotropic parameter \( \alpha = d_{c}/d_{a} \) , where \( d_{a} \) and \( d_{c} \) represent Ce-Ce bond length along the crystallographic a- and c-axis, respectively. A dashed line is a guide to the eye. The schematic drawing represents a hexagonal crystal structure of CeMX.
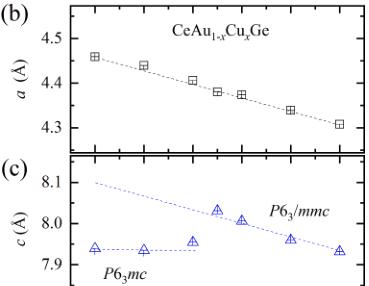
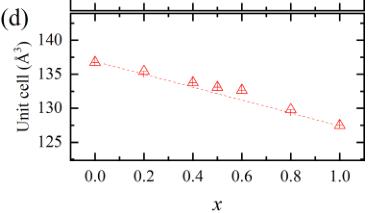
hexagonal layer of Au – Ge breaks the centrosymmetric symmetry \( (P6_{3}mc \) , no. 186), the flat Cu – Ge layer conserves the centrosymmetric symmetry \( (P6_{3}/mmc \) , no. 194) of the hexagonal structure [12,27]. Fig. 2(b) and (c) show lattice parameters of \( CeAu_{1-x}Cu_{x}Ge \) determined from so-called Le Bail fits of the x-ray diffraction patterns using the \( P6_{3}mc \) and \( P6_{3}/mmc \) space groups for \( 0 \leq x \leq 0.5 \) and \( 0.5 < x < 1.0 \) compounds, respectively. In the Le Bail fit, only the crystal metrics and resolution parameters are refined, whereas the integrated Bragg peak intensities are refined independently without any structure model. The crystal structures were determined from the neutron diffraction data (see below). Cu-doping (x) linearly shortens the a-lattice parameter as x increases, decreasing about 3 % at x = 1. On the other hand, the c-lattice parameter exhibits two different linear regimes with an abrupt change near x = 0.5, which can be interpreted by the different crystal symmetry. The unit cell volume linearly decreases as x increases because the a-lattice parameter change is dominant.
3.2. Magnetic properties of \( CeAu_{1-x}Cu_{x}Ge \)
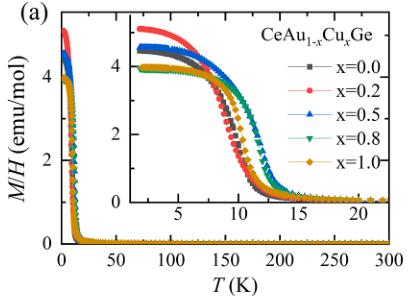
Magnetic susceptibility \( (M/H) \) of \( CeAu_{1-x}Cu_xGe \) is plotted as a function of temperature in Fig. 3(a), and all compounds show FM-like phase transition. Fig. 3(b) shows that the magnetic susceptibility in all samples well follows the Curie-Weiss behaviour at temperatures above 100 K. From the least-squares fits using an equation of \( M/H = M/H(0) + C/(T - \theta) \) ( \( M/H(0) \) : temperature-independent term, C: Curie-constant,
Summary of crystal structure and magnetic properties of CeMX (M = Cu, Ag, Au, and X = Si, Ge, S \( _{n} \) ) intermetallic compounds.
| M | Space group | Type | T_{C}, T_{N} (K) | GS_{CEF} | a ( \( \AA \) ) | c ( \( \AA \) ) | d_{c}/d_{a} | Ref. | |
| CeMSi | Cu | P6_{3}/mmc | FM | 15.5 | 0.87p+0.48q | 4.238 | 7.988 | 0.940 | [10,11] |
| CeMGe | Cu | P6_{3}/mmc | FM | 10.2 | 0.99p+0.01q | 4.311 | 7.933 | 0.920 | [12,13] |
| Ag | P6_{3}mc | AFM | 4.8 | - | 4.544 | 7.711 | 0.850 | [14,15] | |
| P6_{3}/mmc | FM | 6.0 | 4.536 | 7.746 | |||||
| CeMSn | Au | P6_{3}mc | FM | 9.7 | - | 4.460 | 7.936 | 0.890 | [16] |
| Cu | P6_{3}mc | AFM | 8.6 | 0.96p+0.27q a | 4.583 | 7.865 | 0.860 | [12,17] | |
| Ag | P6_{3}mc | AFM | 6.45 | 0.93p+0.35q a | 4.77 | 7.74 | 0.810 | [17,18] | |
| Au | P6_{3}mc | AFM | 0.93p+0.35q a | 4.72 | 7.70 | 0.815 | [17,18] |
\( T_{C} \) , \( T_{N} \) : magnetic ordering temperature, \( d_{c} \) ( \( d_{a} \) ): distance between Ce atoms along the c-axis (a-axis) direction. \( GS_{CEF} \) : crystalline-electric-field ground state with \( p = |1/2 > \) and \( q = |5/2 > \) . \( ^{a} \) Mantid software [19] was used for simulating \( GS_{CEF} \) with the \( B_{n}^{m} \) crystal field parameters given in the references.
(a)

(b)


Fig. 2. (a) Schematic drawing of the centrosymmetric \( CeAuGe\ (P6_{3}/mmc) \) and non-centrosymmetric \( CeCuGe\ (P6_{3}mc) \) crystal structure (upper panel). Powder x-ray diffraction patterns of \( CeAu_{1-x}Cu_{x}Ge\ (x=0,0.5,1.0) \) . Black dot, red line, blue and green bar represent observed data, fit result using Le Bail method (explained in the text), nuclear diffraction positions of \( P6_{3}/mmc \) and \( P6_{3}mc \) , respectively. (b, c) a- and c-lattice parameters as a function of x (d) The unit cell volume as a function of x. The error bars are smaller than the symbol size.
(a)

(c)

(b)

(d)

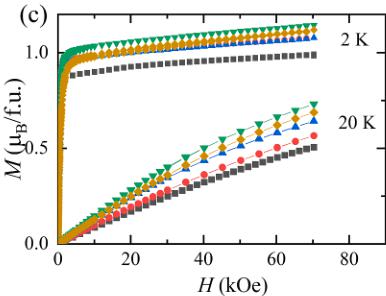
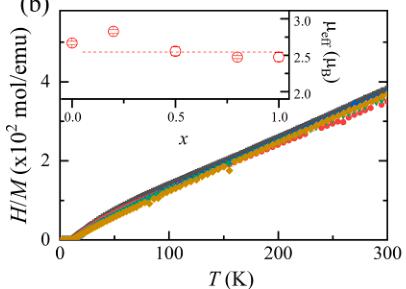
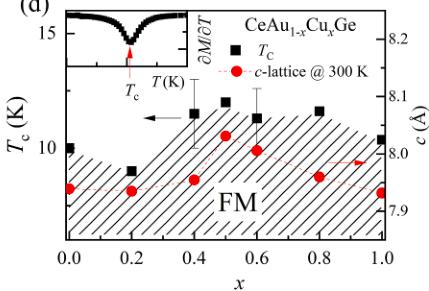
Fig. 3. (a) Magnetic susceptibility \( (M/H) \) of \( CeAu_{1-x}Cu_xGe \) as a function of temperature, the inset shows the data at low temperatures. (b) H/M of \( CeAu_{1-x}Cu_xGe \) is plotted as a function of temperature, and the inset shows each effective magnetic moment deduced from the Curie-Weiss fit at temperatures above 200 K. (c) Magnetization as a function of field of \( CeAu_{1-x}Cu_xGe \) at 2 and 20 K. (d) Curie temperature \( (T_C \) , square symbol) and the room temperature c-lattice parameter (circles) as a function of x on the left and right ordinate, respectively. Inset shows the magnetization derivative \( \partial M/\partial T \) as a function of temperature, which has a minimum at \( T_C \) .
θ: Curie-Weiss temperature), the deduced effective magnetic moment ( \( \mu_{eff} \) ) is plotted as a function of x in the inset of Fig. 3(b). All \( \mu_{eff} \) values are close to 2.54 \( \mu_{B} \) , which is the expected value for J = 5/2 of \( Ce^{3+} \) . The deduced Curie-Weiss temperatures ( \( \Theta \) ) are of negative sign, except for x = 1.0, at temperatures above 100 K. The negative \( \Theta \) at high temperatures is due to the anisotropic magnetic exchange interaction whereby the \( \Theta \) deduced by the field applied along the c-axis is -78(1) K ( \( \Theta = 2.7 \) (5) K for ab-plane) from the single-crystal experiments [28]. As shown in Table 2, the deduced \( \Theta \) from the fit in temperature range from 90 to 30 K is of positive sign and comparable to the Curie temperature. Fig. 3(c) shows the magnetic field dependence of magnetization \( M(H) \) of \( CeAu_{1-x}Cu_xGe \) at temperatures 2 and 20 K. The magnetic moments of \( CeAu_{1-x}Cu_xGe \) at 70 kOe are about \( \sim 1 \mu_B \) at 2 K and it is consistent with the calculated value of 1.05 \( \mu_B \) [29] using the CeCuGe CEF ground state of \( 0.99 \pm 1/2 > + 0.01 \pm 5/2 > [13] \) , implying that all samples in the series might have the similar CEF ground state, mainly \( \pm 1/2 > \) doublet. All samples show paramagnetic behaviour with small FM fluctuations of \( M(H) \) at 20 K. The temperature, where the derivative of magnetization \( \partial M/\partial T \) shows a minimum as depicted in the inset of Fig. 3(d), was assigned to the critical temperature of the ferromagnetic transition ( \( T_C \) ). Fig. 3(d) shows the maximum \( T_C \) near x ~ 0.5 in the T - x axes where the c-lattice parameter has a maximum value.
3.3. Neutron powder diffraction results of \( CeAu_{1-x}Cu_xGe \)
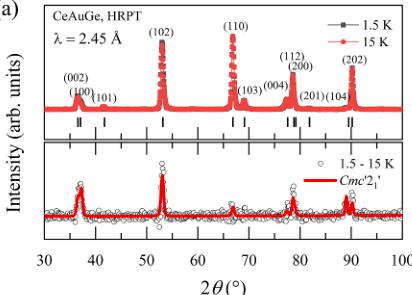
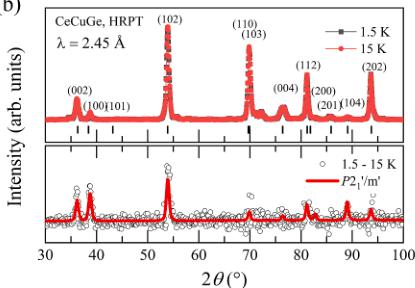
Magnetic and crystal structures of \( CeAu_{1-x}Cu_xGe \) (x = 0.0, 0.2, 0.5, 0.8, 1) were studied using neutron powder diffraction. Table 3 summarizes the results of the Rietveld refinements of the crystal structures from the neutron diffraction patterns measured with neutron wavelength \( \lambda = 1.494 \, \AA \) at 15 K. The best fits were obtained in the space groups \( P6_{3}/mc \) and \( P6_{3}/mmc \) for \( 0 \leq x < 0.5 \) and \( 0.5 \leq x < 1.0 \) , respectively (for details see Fig. S1 in Supplemental Material), in accordance with x-ray diffraction data shown above. For the magnetic structures, the longer wavelength, \( \lambda = 2.54 \, \AA \) , was used to obtain higher resolution for the Bragg peaks at low scattering angles \( 2\theta \) . Fig. 4(a) and (b) show representative diffraction patterns of \( CeAuGe \) and \( CeCuGe \) , respectively. As shown in each upper panel of Fig. 4(a) and (b), the Bragg peak positions at the temperatures 15 and 1.5 K are practically identical, while the Bragg peak intensities at 1.5 K are enhanced. The difference patterns (1.5 - 15 K) for \( CeAuGe \) and \( CeCuGe \) are shown in the lower panel of Fig. 5(a) and (b). Le Bail fits of the difference patterns of \( CeAu_{1-x}Cu_xGe \) show that the propagation vector k of all compounds is zero, k = 0, with the goodness of fit \( \chi^{2} \sim 1 \) (see details Fig. S2 of SM).
3.4. Magnetic structure of \( CeAu_{1-x}Cu_xGe \)
For \( P6_{3}mc \) ( \( 0 \leq x < 0.5 \) ) and the propagation vector k = 0, there are four irreducible representations (irreps) for non-zero Ce moments
Table 2
Curie-Weiss fit results of \( CeAu_{1-x}Cu_xGe \) at two temperature ranges using the equation of \( M/H = M/H(0) + C/(T - \Theta) \) .
| x | T = 300 - 100 K | T = 90 - 30 K | ||||
| M/H(0) (emu/mol) | \( \mu_{\text{eff}} \) ( \( \mu_{\text{B}} \) ) | \( \Theta \) (K) | M/H(0) (emu/mol) | \( \mu_{\text{efr}} \) ( \( \mu_{\text{B}} \) ) | \( \Theta \) (K) | |
| 0.0 | -1.48(16) | 2.68 | -22.6(1) | 2.50(2) | 1.83 | 10.8 |
| x10^{-4} | (2) | x10^{-3} | (1) | (1) | ||
| 0.2 | -1.57(17) | 2.82 | -82.9 | 2.62(08) | 1.40 | 11.3 |
| x10^{-4} | (2) | (15) | x10^{-3} | (03) | (2) | |
| 0.5 | 4.89(48) | 2.55 | -5.1 | 1.83(6) | 2.06 | 11.6 |
| x10^{-6} | (5) | (21) | x10^{-3} | (1) | (1) | |
| x | Space group | a ( \( \text{\AA} \) ) | c ( \( \text{\AA} \) ) | M | Ge W, (1/3, 2/3, z) | B, (1/3, 2/3, z) | R_{wp} R_{exp} \( \chi^{2} \) | |
| R_{wp} | R_{exp} | |||||||
| 0.0 | P6_{3}mc | 4.4570 (1) | 7.8517 (2) | 2b, 0.7640 (10) | 2b, 0.2179 (11) | 16.9 | 5.40 | 9.73 |
| 0.2 | P6_{3}mc | 4.4564 (2) | 7.8481 (4) | 2b, 0.7846 (14) | 2b, 0.2415 (14) | 30.5 | 8.43 | 13.1 |
| 0.5 | P6_{3}/mmc | 4.3931 (1) | 7.8784 (3) | 2c, 0.75 | 2c, 0.25 | 33.0 | 16.4 | 4.04 |
| 0.8 | P6_{3}/mmc | 4.3420 (2) | 7.9252 (6) | 2c, 0.75 | 2c, 0.25 (2) | 46.6 | 21.7 | 4.61 |
| 1.0 | P6_{3}/mmc | 4.2859 (3) | 7.9285 (6) | 2c, 0.75 | 2c, 0,25 | 27.0 | 16.2 | 2.78 |
\(\chi^{2} = (R_{\mathrm{wp}}/R_{\mathrm{exp}})^{2}\). \(\chi^{2}\), \(R_{\mathrm{wp}}\), and \(R_{\mathrm{exp}}\) represent a reduced chi-square, weighted profile factor, and expected weighted profile factor, respectively [23]. The atomic coordinate of Ce 2a (0, 0, z) in \(P6_{3}mc\) is fixed to zero for maintaining crystal symmetry. W represents Wyckoff position in relevant crystal symmetry.
allowed by symmetry. Assuming that the only one irrep is active at the magnetic transition, eight possible magnetic Shubnikov subgroups (labeled as 1, 2, 4–7, 12, and 13 in Fig. S3(a)) are allowed, and four of them (labeled as 1, 2, 5, and 7) have maximal symmetry. For \(P6_{3}/mmc\) (\(0.5 < x < 1.0\)) with \(\mathbf{k} = 0\), four irreps and eight possible magnetic subgroups (labelled as 1, 2, 4–7, 12, and 13 in \(\mathrm{Fig.~S3(b)}\)) are allowed and four of them (labelled as 1, 2, 5, and 7) have maximal symmetry. All Shubnikov magnetic space groups (MSG) were sorted to fit the difference patterns, starting from maximal symmetry subgroups. The best fit results were obtained in the orthorhombic \(\mathrm{Cmc}^{\prime}2_{1}^{\prime}\) (no. 36.175, labeled as 5 in \(\mathrm{Fig.~S3(a)}\)) and monoclinic \(P2_{1}^{\prime}/m^{\prime}\) (no. 11.54, labeled as 12 in \(\mathrm{Fig.~S3(b)}\)) MSG for \(\mathrm{CeAuGe}\) and \(\mathrm{CeCuGe}\) with the goodness of fit \(\chi^{2} \sim 1\) (see the details in \(\mathrm{Fig.~S4}\) of SM). The unit cell metrics and atomic coordinates in the fits with the magnetic space groups were fixed by the values refined from the patterns in paramagnetic state at 15 K. We note that the goodness of fit \(\chi^{2}\) is the same as for the Le Bail fit, implying that there is no room for further improvement because Le Bail fit is model-independent.
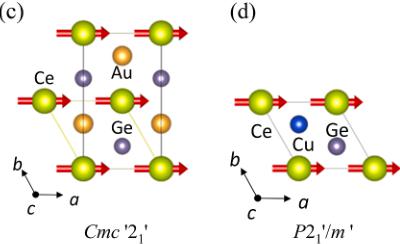
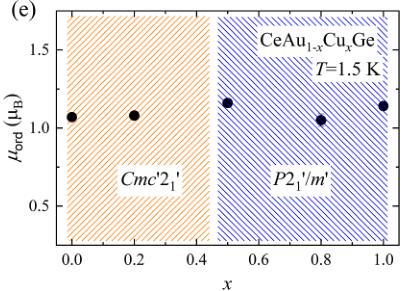
The schematic drawing of the magnetic structures of CeAuGe and CeCuGe is shown in Fig. 4(c) and (d), respectively. The unit cell transformations from parent paramagnetic space groups are given by the following relations A = -b, B = 2a + b, and C = c in \( Cmc^{2}/1' \) and A = a, B = c, and C = -b in \( P2_{1}'/m' \) , where the capital letter and lower case are the basis vectors of the magnetic and the parent paramagnetic space group, respectively. Structure parameters obtained from the fits of neutron diffraction patterns are summarised in Tables S2 and S3. In \( Cmc^{2}2_{1}' \) , the Wyckoff positions for Ce is 4a (0, 0, 0) with magnetic moments allowed only along the crystallographic a-axis. Thus, the magnetic symmetries impose strong constraints on the possible magnetic configurations. On the other hand, the magnetic moments of Ce in Wyckoff position 2a (0, 0, 0) in \( P2_{1}'/m' \) are allowed along the arbitrary direction. The best result of Rietveld refinement, however, was obtained for the moment directed along the a-axis. For both MSGs, the collinear ferromagnetic structure is fixed by symmetry. The refined values of ordered magnetic moments amounted to \( 1.05(2)\mu_{B} \) for CeAuGe and \( 1.11(3)\mu_{B} \) for CeCuGe. They are consistent with the saturated moments in Fig. 3(c) and the previous neutron experiment result of CeAuGe [21]. Fig. 4(e) shows the ordered magnetic moments ( \( \mu_{ord} \) ) as a function of x deduced from the fits of the neutron diffraction patterns (details are given in Table S2 in SM). The samples of \( CeAu_{1-x}Cu_xGe \) with non-centrosymmetric MSG, \( 0 \leq x < 0.5 \) , exhibit the orthorhombic \( Cmc^{2}2_{1}' \) FM structure, while the compositions with centrosymmetric MSG, \( 0.5 \leq x \leq 1 \) .
(a)

(b)

(c)

(e)

Fig. 4. Neutron powder diffraction data collected at 15 and 1.5 K (upper panel) and their difference pattern (lower panel) of \( CeAuGe \) (a) and \( CeCuGe \) (b) are representatively displayed. The red line in the lower panel represents the best fit results using the Shubnikov magnetic space group \( Cmc'2_{1}' \) for \( CeAuGe \) and \( P2_{1}'/m' \) for \( CeCuGe \) . The schematic magnetic structures of \( CeAuGe \) and \( CeCuGe \) are displayed in (c) and (d), respectively. (e) The sizes of ordered magnetic moments obtained from the fits on the difference \( (1.5 - 15\ \mathrm{K}) \) pattern are plotted as a function of x.
\( x \leq 1.0 \) , adopt \( P2_{1}'/m' \) monoclinic symmetry. We note that the FM structures are similar but have different crystallographic symmetries.
3.5. Electrical resistivity of \( CeAu_{1-x}Cu_{x}Ge \)
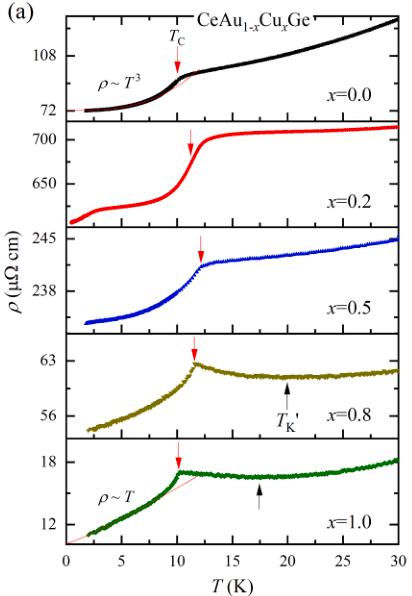
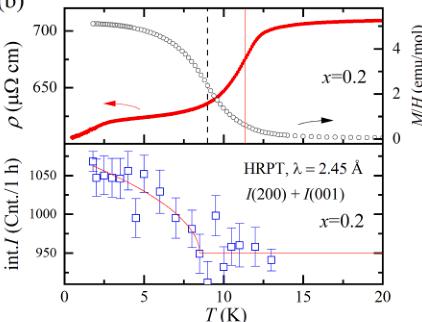
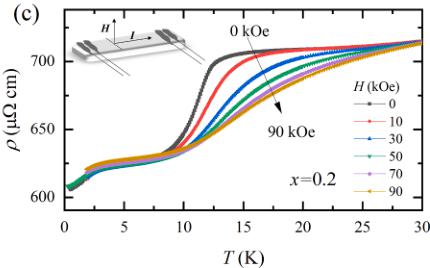
Fig. 5(a) shows the zero-field electrical resistivity as a function of temperature \( (\rho(T)) \) of \( CeAu_{1-x}Cu_{x}Ge \) with showing high resistivity values and metallic behaviour, which are consistent with the previous report [30]. The residual-resistance ratio (RRR) coefficients of \( CeAu_{1-x}Cu_{x}Ge \) are of range from 1.2 to 10.6 (details are given in Table S4 in SM). The first-principles calculations show that \( CeAuGe \) and \( CeCuGe \) both are classified to the semimetal [31]. As shown in the top panel, \( CeAuGe \) (x = 0) exhibits a kink (red downward arrow) which is consistent with the \( T_{C} \) determined by a dip of \( \partial M/\partial T \) . Except for x = 0.2, \( \rho(T) \) in every panel shows the apparent kink at \( T_{C} \) . At temperatures above \( T_{C} \) , a local minimum ( \( T_{K^{*}} \) ) in \( \rho(T) \) is observed in x = 0.8 and 1.0 due to the Kondo effects, suggesting that the Kondo hybridization between \( 4f^{1} \) and conduction electrons becomes stronger near x ~ 1. The local minimum in \( \rho(T) \) is better visually seen in the plot in the overall temperature range, as shown in Fig. S5. Upper panel of Fig. 5(b) shows \( \rho(T) \) and \( M(H) \) of x = 0.2 plotted as a function of temperature on the left and right ordinate, respectively. The transition temperatures of \( \rho(T) \) and \( M(H) \) were determined by the peak of \( \partial M/\partial T \) (black dashed line) and \( \partial \rho/\partial T \) (solid red line) for x = 0.2 and separated by \( \sim 2 \) K due to the broadened FM phase transition. In addition, the resistivity \( \rho(T) \) exhibits a broad hump in the ferromagnetic state around 2.5 K. The lower panel of Fig. 5(b) shows neutron integrated intensity (int. I) for x = 0.2 as a function of temperature obtained from the Gaussian fits of two most intense magnetic peaks (200) and (001). The FM contribution appears below 8 K, consistent with the magnetization \( \partial M/\partial T \) . As shown in Fig. 5(c), on the other hand, resistivity exhibits a drop near 12.5 K then moderately decreases from \( \sim 8 \) K, where the bulk \( T_{C} \) is observed. With further lowering the temperature, the transition-like broad hump is observed below 2.5 K, and it decreases down to 0.28 K. When subjected to the magnetic field applied along the out-of-plane direction, the onset temperature of the resistivity drop at 12.5 K is increased and broadened as the field increases, while the transition-like feature around 2.5 K stays robust up to 50 kOe.
4. Discussion
Distances between the hexagonal Ce-layers \( (d_{\mathrm{c}} \) as defined in Fig. 1) of \( \mathrm{CeAuGe} \) (3.968(1) A) and \( \mathrm{CeCuGe} \) (3.967(1) A) are similar. Band structures of \( \mathrm{ScAuGe} \) , \( \mathrm{CeAuGe} \) , and \( LuAuGe \) calculated using TB-LMTO-ASA (Tight-Binding, Linear Muffin-Tin Orbital, Atomic-Sphere Approximation) program show that the larger spacing \( d_{c} \) leads to the smaller inter-layer interaction [27]. As shown in Fig. 3(d), the maximum \( d_{c} \) is observed at \( x \sim 0.5 \) , where the Curie temperature \( T_{C} \) reaches the maximum value of 12 K. The higher \( T_{C} = 15.5 \) K in \( \mathrm{CeCuSi} \) [10] can be interpreted by the larger \( d_{c} = 3.994 \) Å than the one in \( \mathrm{CeAuGe} \) and \( \mathrm{CeCuGe} \) . Similar behaviour was reported in \( \mathrm{CeCuGe}_{1-x}\mathrm{Sn}_{x} \) that the \( T_{C} \) is proportional to the interlayer distance. On the other hand, \( T_{C} \) is inverse proportional to the interlayer distance in \( \mathrm{CeCu}_{1-x}\mathrm{Al}_{x}\mathrm{Ge} \) , in which Al-doping was expected to screen Ce moments with a higher electron density. \( T_{C} \) in \( \mathrm{CeAu}_{1-x}\mathrm{Cu}_{x}\mathrm{Ge} \) may be correlated with not only the interlayer interaction but also conduction electron density by the chemical doping.
The similar anisotropic parameters \( a = d_{c}/d_{a} \) of \( CeAu_{1-x}Cu_{x}Ge \) are responsible for the similar magnetic properties and collinear ferromagnetic structure. While the magnetic properties of \( CeAu_{1-x}Cu_{x}Ge \) compounds are similar, the electrical resistivity exhibits different behaviours depending on doping concentration x. \( CeCuGe \) exhibits the local
(a)

(b)


Fig. 5. (a) Electrical resistivity of \( CeAu_{1-x}Cu_xGe \) as a function of temperature, \( \rho \) (T), in each panel from top to bottom (x = 0.0, 0.2, 0.5, 0.8, 1.0). Red downward and black upward arrows indicate the Curie temperature and the local minimum in \( \rho(T) \) . Red solid line represents a least-squares fit using \( \rho(T) = \rho_0 + A T^n \) . (b) \( \rho(T) \) and M/H of x = 0.2 are plotted using left and right ordinate, respectively, in the upper panel, and neutron integrated intensity (int.I) of the sum of two magnetic peaks (200) and (001) of x = 0.2 is plotted in the lower panel. Dashed black and solid red lines in the upper panel represent the peak of \( \partial M/\partial T \) and \( \partial \rho/\partial T \) , respectively. In the lower panel, the red line shows the best result of least-squares fit from int.I = bkg + B(1-Tc/T) \( ^{2\nu} \) with bkg = 950, B = 127(10), \( T_C = 8.5(1) \) , and \( \nu = 0.26(7) \) . (c) \( \rho(T) \) of x = 0.2 was measured under various magnetic fields applied perpendicular to the measured sample surface, as shown in the inset. Black arrows indicate the field dependence of \( \rho(T) \) as the field increases.
minimum of \( \rho(T) \) at 17.5 K due to the Kondo scattering and T-linear behaviour in the FM state. On the other hand, \( \rho(T) \sim T^{3} \) behaviour in the FM state was observed in CeAuGe without the local minimum of \( \rho(T) \) . Note that the fit by a gap function, \( \rho(T) \sim T^{\alpha}\exp(-\Delta/k_{\mathrm{B}}T) \) , does not work for both cases. Since the temperature exponent of resistivity in CeCuGe and CeAuGe polycrystals are different from the one expected in the ferromagnetic metals [32,33], \( \rho(T) \) measurements on single crystals and at lower temperatures might help to understand the scattering mechanism in the FM state. As shown in Fig. 5(b), the small Cu-doping in CeAuGe suppresses FM transition temperature to 8 K, while other doping cases show \( T_{C} \) higher than x = 0.0 and 1.0. Further experiments with x = 0.2 concentration and other small doping contents can be useful to elucidate the origin of the broad transition at 12.5 K and the low-temperature transition-like feature at 2.5 K that are seen only in the electrical resistivity.
5. Conclusion
Cu-doping effects in the hexagonal ferromagnet CeAuGe have been studied on polycrystalline series of \( CeAu_{1-x}Cu_xGe \) (x = 0.0, 0.2, 0.4, 0.5, 0.6, 0.8, 1.0) using x-ray and neutron (except x = 0.4 and 0.6) diffraction, electrical resistivity and magnetization as a function of temperature and magnetic field. The doping changes the crystal structure from the non-centrosymmetric ( \( P6_{3}mc \) ) to the centrosymmetric ( \( P6_{3}/mmc \) ) space group at the critical concentration \( x_{c} \sim 0.5 \) . The magnetic moments of Ce are ferromagnetically ordered in the Shubnikov magnetic space groups \( Cmc'2_{1}' \) and \( P2_{1}'/m' \) below and above \( x_{c} \) , respectively. The Curie temperature \( T_{C} \) depends on concentration and reaches the maximum value \( T_{C} = 12 \) K at \( x = x_{c} \) , where the distance between Ce-layer shows the maximal value. The magnetic moments are oriented perpendicular to the hexagonal c-axis with the sizes slightly dependent on concentration amounting to \( 0.95(2) - 1.16(1) \mu_{B} \) at 1.5 K. The electrical resistivity exhibits metallic temperature dependence and a pronounced sharp change at the ferromagnetic transition for all concentrations except for x = 0.2. The resistivity \( \rho(T) \) has a local minimum in the paramagnetic state due to Kondo effects at high doping levels \( x > 0.5 \) . The sample with the small doping x = 0.2 shows different from other concentrations behaviour of electrical resistivity. The transition seen by resistivity is broadened and shifted to 12.5 K, which is higher than the bulk \( T_{C} \) and in addition, there is a transition-like feature in the ferromagnetic state at 2.5 K. Further experiments with the low doping content samples can be useful to elucidate the origin of the above peculiarities.
The data that support this study are available via the Zenodo repository [34].
CRediT authorship contribution statement
Soohyeon Shin: Conceptualization, Investigation, Formal analysis, Writing – original draft. Vladimir Pomjakushin: Investigation, Formal analysis, Writing – review & editing. Marek Bartkowiak: Investigation. Marisa Medarde: Investigation, Writing – review & editing. Tian Shang: Investigation, Writing – review & editing. Dariusz J. Gawryluk: Investigation. Ekaterina Pomjakushina: Funding acquisition, Conceptualization, Investigation, Formal analysis, Writing – review & editing.
Declaration of Competing Interest
The authors declare that they have no known competing financial interests or personal relationships that could have appeared to influence the work reported in this paper.
Acknowledgments
Work at the Paul Scherrer Institut in Switzerland was supported by SNSF Projects No. 200021_188706 and 206021_139082. Neutron scattering experiments were carried out at the continuous spallation neutron source SINQ at the Paul Scherrer Institut at Villigen PSI in Switzerland. Magnetization measurements were performed at the Laboratory for Multiscale Materials Experiments at the Paul Scherrer Institute. T.S. acknowledges support from the Natural Science Foundation of Shanghai (Grant Nos. 21ZR1420500 and 21JC1402300).
Appendix A. Supplementary material
Supplementary data to this article can be found online at https://doi.org/10.1016/j.jmmm.2022.169147.
References
[1] F. Steglich, J. Aarts, C.D. Bredl, W. Lieke, D. Meschede, W. Franz, H. Schäfer, Phys. Rev. Lett. 43 (1979). Article 1892.
[2] G.R. Stewart, Rev. Mod. Phys. 56 (1984). Article 755.
[3] R. Movshovich, M. Jaime, J.D. Thompson, C. Petrovic, Z. Fisk, P.G. Pagliuso, J. L. Sarrao, Phys. Rev. Lett. 86 (2001). Article 5152.
[4] P. Puphal, V. Pomjakushin, N. Kanazawa, V. Ukleev, D.J. Gawryluk, J. Ma, M. Naamneh, N.C. Plumb, L. Keller, R. Cubitt, E. Pomjakushina, J.S. White, Phys. Rev. Lett. 124 (2020), 017202.
[5] A. Dönni, G. Ehlers, H. Maletta, P. Fischer, H. Kitazawa, and M. Zolliker, J. Phys: Condens. Matter 8 (1996), Article 11213.
[6] S. Shin, V. Pomjakushin, L. Keller, P.F.S. Rosa, U. Stuhr, C. Niedermayer, R. Sibille, S. Toth, J. Kim, H. Jang, S.K. Son, H.O. Lee, T. Shang, M. Medarde, E.D. Bauer, M. Kenzelmann, T. Park, Phys. Rev. B 101 (2020), 224421.
[7] T. Park, F. Ronning, H.Q. Yuan, M.B. Salamon, R. Movshovich, J.L. Sarrao, J. D. Thompson, Nature 440 (2006) 65–68.
[8] A. Schröder, G. Aeppli, R. Coldea, M. Adams, O. Stockert, H. v. Löhneysen, E. Bucher, R. Ramazashvili, and P. Coleman, Nature 407 (2000), pp. 351–355.
[9] S. Doniach, Physica B+C 91 (1977) 231–234.
[10] D. Gignoux, D. Schmitt, M. Zerguine, Solid State Commun. 58 (1986) 559–562.
[11] B.M. Sondezi-Mhlungu, D.T. Adroja, A.M. Strydom, S. Paschen, E.A. Goremychkin, Physica B 404 (2009). Article 3032.
[12] F. Yang, J.P. Kuang, J. Li, E. Brück, H. Nakotte, F.R. de Boer, X. Wu, Z. Li, Y. Wang, J. App. Phys. 69 (1991). Article 4705.
[13] B.M. Sondezi-Mhlungu, D.T. Adroja, Å.M. Strydom, W. Kockelmann, E. A. Goremychkin, J. Phys. Conf. Ser. 200 (2010), 012190.
[14] V.K. Pecharsky, K.A. Gschneidner, O.I. Bodak, A.S. Protsky, J. Less-Common Met. 168 (1991) 257–267.
[15] E. Corduwisch, P. Rogl, D. Kaczorowski, A. Saccone, R. Ferro, J. Phase Eq. 20 (1999) 407–422.
[16] D. Rossi, R. Marazza, R. Ferro, J. Alloys Comp. 187 (1992) 267–270.
[17] D.T. Adroja, B.D. Rainford, A.J. Neville, J. Phys.: Condens. Matter 9 (1997) L391–L395.
[18] M. Lenkewitz, S. Corsépius, G.R. Stewart, J. Alloys Comp. 241 (1996) 121–123.
[19] O. Arnold, et al., Nucl. Instrum. Methods Phys. Res. 764 (2014) 156–166.
[20] H.-Y. Yang, B. Singh, J. Gaudet, B. Lu, C.Y. Huang, W.C. Chiu, S.M. Huang, B. Wang, F. Bahrami, B. Xu, J. Franklin, I. Sochnikov, D.E. Graf, G. Xu, Y. Zhao, C. M. Hoffman, H. Lin, D.H. Torchinsky, C.L. Broholm, A. Bansil, F. Tafti, Phys. Rev. B 103 (2021), 115143.
[21] B.J. Gibson, R. Pöttgen, R.K. Kremer, Physica B 734 (2000) 276–278.
[22] P. Fischer, et al., Physica B 146 (2000) 276–278.
[23] J. Rodríguez-Carvajal, Physica B 192 (1993) 55–69.
[24] M.I. Aroyo, J.M. Perez-Mato, D. Orobengoa, E. Tasci, G. De La Flor, A. Kirov, Bulg. Chem. Commun. 43 (2011) 183–197.
[25] B.J. Campbell, H.T. Stokes, D.E. Tanner, D.M. Hatch, J. App. Cryst. 39 (2006) 607–614.
[26] H. T. Stokes and D. M. Hatch, Isotropic Subgroups of the 230 Crystallographic Space Groups (1988).
[27] R. Pöttgen, H. Borrmann, C. Felser, O. Jepsen, R. Henn, R.K. Kremer, A. Simon, J. Alloys Comp. 235 (1996) 170–175.
[28] B. J. Gibson, Loughborough University. Thesis (1998), pp. 107-109.
[29] The polycrystalline-averaged value of the magnetic moment \( m_{pol} \) is calculated by \( m_{pol} = (2/3) m_{ab}^{2} + 1/3 m_{c}^{2} \) ^{0.5}, where \( m_{ab} \) and \( m_{c} \) represent the in-plane and out-of-plane component of the magnetic moment, respectively. \( m_{ab} = g_{1} \mu_{B} \leq \Gamma |J_{x}| \Gamma > \) and \( m_{c} = g_{1} \mu_{B} \leq \Gamma |J_{z}| \Gamma > \) , where the Landé g factor, \( g_{1} \) , is 6/7, \( \Gamma \) is the CEF ground state of \( 0.99 \pm 1/2 \div +0.01 \pm 5/2 \times 10^{-5} \) . Note that \( J_{x} |J_{z}| m > 1 = 2 / (J_{z} + J) |J_{z}| m > \) and \( J_{z} |J_{z}| m > = m |J_{z}| m > \) , when \( J_{z} |J_{z}| m > = [j(j + 1) - m (m \pm 1)]^{1/2} |J_{z}| m \pm 1 > \) . J and m indicate the total angular and spin quantum number, respectively.
[30] R. Pöttgen, H. Borrmann, R.K. Kremer, J. Magn. Magn. Mater. 152 (1996)
[31] B. Bradlyn, L. Elcoro, J. Cano, M.G. Vergniory, Z. Wang, C. Felser, M.I. Aroyo, B. A. Bernevig, Nature 547 (7663) (2017) 298–305.
[32] D. A. Goodings, Phys. Rev. 132 (1963), Article 542.
[33] J. Mathon and H. Jones, Proc. Roy. Soc. Lond. Math. Phys. Sci. 306 (1968), Article 355.
[34] S. Shin, the dataset for “Cu-doping effects on the ferromagnetic semimetal CeAuGe” (2021), DOI: 10.5281/zenodo.5734908.
 p1_0.jpg
 p2_0.jpg
 p3_0.jpg
 p3_1.jpg
 p3_2.jpg
 p3_3.jpg
 p3_4.jpg
 p3_5.jpg
 p3_6.jpg
 p5_0.jpg
 p5_1.jpg
 p5_2.jpg
 p5_3.jpg
 p6_0.jpg
 p6_1.jpg
 p6_2.jpg