| Transition Temperature | 163 K |
|---|---|
| Experiment Temperature | 150 K |
| Propagation Vector | k1 (0, 0, 0) |
| Parent Space Group | I4/mmm (#139) |
| Magnetic Space Group | I4'/mm'm (#139.534) |
| Magnetic Point Group | 4'/mm'm (15.4.56) |
| Lattice Parameters | 4.13108(3) 4.13108(3) 18.8354(2) 90.00 90.00 90.00 |
|---|---|
| DOI | 10.1103/PhysRevB.82.214419 |
| Reference | N. Ni, E. Climent-Pascual, S. Jia, Q. Huang, R. J. Cava, PHYSICAL REVIEW B (2010) 82 214419 |
| Label | Element | Mx | My | Mz | |M| |
|---|---|---|---|---|---|
| Mn1 | Mn | 0.0 | 0.0 | 2.17 | 2.17 |
Physical properties and magnetic structure of the layered oxyselenide La_{2}O_{3}Mn_{2}Se_{2}
N. Ni, \( ^{1} \) E. Climent-Pascual, \( ^{1} \) S. Jia, \( ^{1} \) Q. Huang, \( ^{2} \) and R. J. Cava \( ^{1} \)
\( ^{1} \) Department of Chemistry, Princeton University, Princeton, New Jersey 08540, USA
\( ^{2} \) NIST Center for Neutron Research, National Institute of Standards and Technology, Gaithersburg, Maryland 20899, USA (Received 29 September 2010; revised manuscript received 21 November 2010; published 16 December 2010)
We report the characterization of the layered rare-earth manganese oxyselenide \( La_{2}O_{3}Mn_{2}Se_{2} \) . The susceptibility data show a broad maximum near 350 K, indicating the existence of two-dimensional (2D) short-range ordering in this compound. A sharp feature associated with a short-range to long-range antiferromagnetic phase transition is seen at 163 K. A very small heat-capacity anomaly is detected around 163 K, indicating that most of the magnetic entropy is lost during the 2D ordering process. Both crystal and magnetic structures were studied by neutron powder diffraction at 300, 200, 150, 100, and 6 K. The structure was refined in space group I4/mmm with \( a=4.13\,939(3) \) Å and \( c=18.8511(2) \) Å at ambient temperature. No structural distortion was detected. The resulted magnetic structure is G-type with a propagation vector of \( \mathbf{k}=(0,0,0) \) and an ordered magnetic moment of \( 4.147(28)\,\mu_{B}/Mn \) along c is found at 6 K. Warren peak shape analysis of the neutron-diffraction data near \( 22^{\circ} \) is employed to characterize the increase in correlation length in the 2D magnetic state on approaching the three-dimensional ordering transition.
DOI: 10.1103/PhysRevB.82.214419
PACS number(s): 75.25.−j, 75.30.Cr, 75.40.−s
I. INTRODUCTION
Layered transition-metal compounds have been one of the major research thrusts in condensed-matter physics for decades. Many interesting properties such as high- \( T_{c} \) superconductivity and colossal magnetoresistance have been discovered in these systems. The recent discovery of high- \( T_{c} \) superconductivity in layered Fe-oxypnictides has reenergized the scientific community to search for layered transition-metal compounds. \( ^{1,2} \) A family of layered compounds that has been studied very little, \( ^{3-6} \) transition-metal oxychalcogenides with formula \( La_{2}O_{3}T_{2}Se_{2} \) , crystallizes in the 14/mmm space group and shows chemical, structural, and magnetic similarities to the pnictides and \( Fe_{1+x}Se \) . \( ^{7,8} \) It possesses \( [La_{2}O_{2}]^{2+} \) sheets made of edge sharing \( OLa_{4} \) tetrahedra alternating with \( [T_{2}OSE_{2}]^{2-} \) sheets. The \( T^{2+} \) transition-metal ions form a square spin lattice, as is seen in the pnictide superconductors, but the polyhedral coordination geometry in the plane consists of \( TSe_{4}O_{2} \) octahedra sharing faces. The Fe and Co variants have been previously reported, \( ^{4,5} \) they show semiconductor behavior with \( E_{g} \sim 0.19 \) eV and 0.35 eV, respectively. \( ^{4,5} \) Antiferromagnetic (AFM) phase transitions with \( T_{N} = 93 \) K for \( La_{2}O_{3}Fe_{2}Se_{2} \) and 220 K for \( La_{2}O_{3}Co_{2}Se_{2} \) have also been reported. \( ^{4,5} \) However, the structure-property relations have not yet been established in this family and no neutron-diffraction studies have been reported. Recent theoretical calculations \( ^{4,9} \) suggest that stronger electron-electron interactions should be found in these compounds than are found in the LaFeAsO family due to 3d band narrowing, which is consistent with experiment but the theoretically predicted \( Co^{2+} \) high spin state is not in agreement with the low spin state inferred from susceptibility and heat-capacity measurements in \( La_{2}O_{3}Co_{2}Se_{2} \) . \( ^{9} \) The structures of the magnetically ordered states have only been established for \( La_{2}O_{3}Fe_{2}Se_{2} \) , \( ^{10} \) although they are important for refining the theoretical picture and to help determine whether superconductivity might be induced by appropriate chemical doping. Orbital ordering within the \( t_{2g} \) manifold has been theoretically predicted in spite of the fact that their room-temperature crystal structure shows no sign of such an effect. \( ^{9} \) Therefore it is also important to look for structural phase transitions in these compounds at low temperatures: orbital ordering, if present, is expected to be a critical influence on the properties.
To shed some light on these questions, a layered compound, \( La_{2}O_{3}Mn_{2}Se_{2} \) , isostructural with the Co and Fe variants, is reported here. It is an insulator with a room-temperature resistance larger than 10 MΩ. Magnetic susceptibility, heat-capacity, and neutron-diffraction measurements were performed. The susceptibility data reveal that two-dimensional (2D) short-range ordering exists in \( La_{2}O_{3}Mn_{2}Se_{2} \) near ambient temperature, followed by a 2D short-range to three-dimensional (3D) long-range AFM ordering phase transition at 163 K. Thus the system displays a relatively large temperature regime of two-dimensional magnetic ordering before the 3D ordering sets in. Instead of a significant magnetic specific-heat peak, only a very small feature is detected near 163 K in the heat-capacity data, indicating that the magnetic entropy is primarily lost in the 2D ordering process. The analysis of the neutron powder-diffraction data shows the compound to have a G-type AFM structure with an ordered magnetic moment of \( 4.147(28) \) \( \mu_{B}/Mn \) at 6 K along the c direction. The neutron spectra also confirm that the 2D short-range ordering is followed by a 2D to 3D long-range AFM transition between 200 and 150 K.
II. EXPERIMENTAL METHODS
10 g of polycrystalline \( La_{2}O_{3}Mn_{2}Se_{2} \) ; was synthesized by conventional solid-state reaction. Dried \( La_{2}O_{3} \) powder, bright Mn powder, and Se powder were employed as starting materials. Starting materials were weighed in the stoichiometric ratio, and then mixed thoroughly and pressed into four pellets inside an Ar-filled glove box. Each pellet was

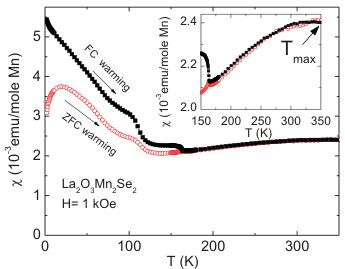
FIG. 1. (Color online) ZFC and FC \( \chi(T) \) data taken in an applied field of 1 kOe. Inset: enlarged \( \chi(T) \) at high temperature.
then sealed into a 15 cm diameter quartz tube under 1/3 atmosphere Ar pressure. They were slowly heated to 650 °C, held for 12 h, and then heated to 1050 °C and heated for 10 days, with two intermediate grindings in the glove box. The quartz tube was then air cooled.
dc magnetization, \( M(H) \) and \( M(T) \) , were measured in a Quantum Design (QD) magnetic properties measurement system with superconducting quantum interface device magnetometer (SQUID). An as-grown piece around 100 mg without grinding was used. \( M(H) \) measurements were carried out from 0 to 50 kOe at 2, 60, 90, 120, 150, 180, 240, and 300 K from a demagnetized state. A hysteresis loop was measured at 2 K. Field-cooled (FC) warming and zero field-cooled (ZFC) warming temperature-dependent magnetization measurements were performed at 1 kOe from 2 to 350 K; susceptibilities were calculated as \( \chi=M(T)/H \) . Temperature-dependent heat capacities were measured in a QD physical properties measurement system using the relaxation technique at zero field. The powder sample was mixed with Ag powder in the mass ratio of 1:1 to ensure better thermal conduction and then pressed into a pellet. A 9.9 mg piece cut from this pellet was employed.
Neutron powder-diffraction measurements were performed at 300, 200, 150, 100, and 6 K on the BT1 diffractometer at the NIST Center for Neutron Research (NCNR) using a Cu (311) monochrometer, with a neutron wavelength of 1.5403 Å. Finely ground powder was used in the measurements. Rietveld refinements were carried out using the FULLPROF program suite. \( ^{[11]} \) The Bragg peaks were refined with the Thompson-Cox-Hastings pseudo-Voigt axial divergence asymmetric peak shape.
III. EXPERIMENTAL RESULTS AND DISCUSSION
A. Magnetic susceptibility and heat capacity
The temperature-dependent susceptibility is presented in Fig. 1. Both ZFC warming and FC warming data are shown. The susceptibility ranges from \( 2 \times 10^{-3} \) emu/mole Mn to \( 5.5 \times 10^{-3} \) emu/mole Mn. No Curie-Weiss behavior is observed up to the highest temperature measured, 350 K. Instead, a broad maximum near 350 K, shown by the arrow in the inset of Fig. 1, with no bifurcation between FC and ZFC data, is detected (inset of Fig. 1), which suggests the pres

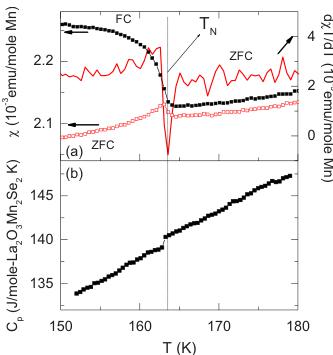
FIG. 2. (Color online) (a) Enlarged \( \chi(T) \) near the long-range AFM phase transition; the criterion to infer \( T_{N} \) is shown in the \( d(\chi T)/dT \) plot. (b) Temperature-dependent heat capacity of \( La_{2}O_{3}Mn_{2}Se_{2} \) .
ence of low-dimensional short-range spin correlations among Mn ions at high temperatures. \( ^{12} \) At lower temperatures, the ZFC and FC data differ. A detail of the magnetic susceptibility near 160 K is shown in Fig. 2(a) together with a plot of \( d(\chi T)/dT \) (ZFC data). The ZFC data show a sharp cusp in the susceptibility, the signature of an AFM phase transition. A Néel temperature of \( T_{N}=163\pm0.5 \) K can be inferred from the \( d(\chi T)/dT \) plot using the conventional criterion. The FC data deviate from the ZFC data below 163 K; it shows a sharp upturn instead of the rapid decrease seen in the ZFC data on cooling, suggesting the presence of a ferromagnetic contribution to the susceptibility below 163 K. Temperature decreases further, an abrupt susceptibility increase occurs around 120 K. This may be due to the occurrence of spin reorientation at this temperature, which is plausible for an anisotropic magnetic system. \( ^{13} \)
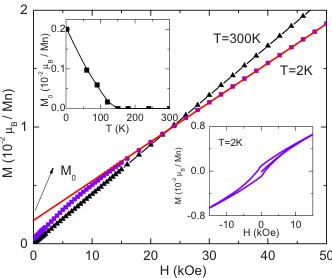
The virgin magnetization curves are shown in Fig. 3. For clarity, only the data taken at \( T=300 \) and 2 K are presented; the other data are analogous. At \( T=300 \) K, the magnetization data are linearly proportional to the applied field. At T

FIG. 3. (Color online) Virgin \( M(H) \) data taken at \( T=300 \) and 2 K. The magnetization value inferred from the intersection between the red solid line and y axis is defined as \( M_{0} \) . Insets: top: \( M_{0} \) vs T; bottom: hysteresis loop measured at \( T=2 \) K.
=2 K, however, a weak ferromagnetic component occurring at low fields is superimposed on the linear term. This is consistent with our FC and ZFC \( M(T) \) data, which implies the presence of a ferromagnetic component in the antiferromagnetically ordered state. By using the intersection with the y axis of the linear extrapolation from the high-field data, as shown in the inset of Fig. 3, we can estimate the spontaneous moment \( M_{0} \) at T=2, 60, 90, 120, 150, 180, 240, and 300 K. These data are summarized in the top inset of Fig. 3. They show that \( M_{0} \) increases almost linearly, from \( 1.7 \times 10^{-4} \mu_{B}/Mn \) at 120 K to \( 2 \times 10^{-3} \mu_{B}/Mn \) at 2 K, which is quite a small value compared to the expected 5 \( \mu_{B} \) for fully ferromagnetically ordered S=5/2 \( Mn^{2+} \) ions. The bottom inset of Fig. 3 presents the hysteresis loop measured at 2 K. As can be seen, the inferred coercive field is 1.1 kOe, and the remanent magnetization is 0.094 emu/mole Mn. This weak ferromagnetism does not likely result from the effect of the applied magnetic field (metamagnetism), since \( M(H) \) of a metamagnetic phase transition is normally characterized by a linear term at low field and an abrupt increase at higher field, which is distinguishable from the behavior observed in Fig. 3. The weak ferromagnetism is most likely intrinsic, caused by spin canting, \( ^{13,14} \) probably due to spin-orbit effects from the Dzyaloshinskii-Moriya antisymmetric exchange interaction and the anisotropic symmetric exchange interaction in the distorted \( MnSe_{4}O_{2} \) octahedron. \( ^{13-15} \) Therefore, the magnetic data indicate that \( La_{2}O_{3}Mn_{2}Se_{2} \) undergoes a transition to a canted antiferromagnetic state at 163 K with a resulting parasitic ferromagnetic component arising from a small-angle canting of the nearly antiparallel \( Mn^{2+} \) spins.
Figure 2(b) presents the \( C_{p}(T) \) data for \( La_{2}O_{3}Mn_{2}Se_{2} \) , measured from 150 to 180 K. The heat capacity of Ag (Ref. 16) has been subtracted from the raw data. The \( \lambda \) -shape magnetic heat-capacity peak usually associated with an AFM phase transition is not seen in the \( C_{p} \) data; only a very subtle feature is observed at 163 K due to the 3D magnetic ordering, which suggests that the magnetic entropy has been gradually released above 163 K, consistent with the implication of the susceptibility data: an extensive 2D short-range magnetic ordering regime exists above 163 K. The absence of a heat-capacity peak at the 3D long-range ordering temperature is also observed in other highly 2D magnetic systems, for example, in \( BaNi_{2}V_{2}O_{8} \) , a 2D antiferromagnet. \( ^{13} \) This can be readily understood for \( La_{2}O_{3}Mn_{2}Se_{2} \) . The \( T_{max} - T_{N} \) values are around 190, 30, and 50 K for T=Mn, Fe, and Co compounds, respectively. Because \( T_{max} \) is an indicator of the 2D ordering (see below), this shows the presence of a much broader temperature range to release entropy above \( T_{N} \) for \( La_{2}O_{3}Mn_{2}Se_{2} \( than for the other members of the family. What is more, for the Fe and Co analogs, in spite of a sharp peak occurring at \) T_{N} \( , the magnetic entropy is much smaller than the expected value of R \) \ln(2S+1) \( . For \) La_{2}O_{3}Fe_{2}Se_{2} $ , the entropy release is less than 15% of R ln 5, the value for high spin ) Fe^{2+} \( ions, if a polynomial fitting is employed as the lattice contribution. \( ^{6} \) Comparing these compounds, \( La_{2}O_{3}Mn_{2}Se_{2} \) . has a higher \( T_{max} \sim 350 K \) (the values are around 120 and 270 K for the Fe and Co analogs, respectively \( ^{4,5} \) ). Since for a highly two-dimensional system, \( T_{max} \) is proportional to the nearest-neighbor spin exchange, \( ^{17,18} \) i.e., is the measure of the intralayer coupling,

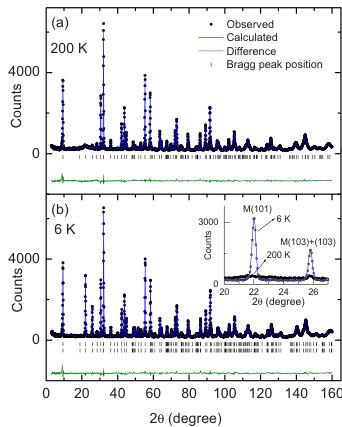
FIG. 4. (Color online) (a) Neutron powder-diffraction pattern for \( La_{2}O_{3}Mn_{2}Se_{2} t \) taken at 200 K. Upper black dots, observed pattern; upper blue curve, calculated pattern; tick marks, calculated peak positions; lower curve, difference between observed and calculated pattern. (b) Neutron powder-diffraction pattern for \( La_{2}O_{3}M_{n}Se_{2} t \) taken at 6 K [details as described for (a)]. Upper tick marks, calculated structural peak positions; lower tick marks, calculated magnetic peak positions. Inset: detail of selected region for patterns collected at 200 and 6 K. “M” stands for the magnetic Bragg peak.
the higher \( T_{max} \) in \( La_{2}O_{3}Mn_{2}Se_{2} \) ; indicates that it really is more two-dimensional. From the structural perspective side, the T-Se-T angle for T=Mn, Fe, and Co, are \( 95.05^{\circ} \) , \( 97.04^{\circ} \) , and \( 98.42^{\circ} \) , respectively, and although the differences are small, the T-Se-T superexchange is expected to be very sensitive to the angle in the distorted \( MnSe_{4}O_{2} \) octahedron, and could be responsible for the stronger intralayer interaction in the Mn compound.
B. Neutron diffraction
To solve the magnetic structure of \( La_{2}O_{3}Mn_{2}Se_{2} \) ,neutron powder-diffraction data were collected at T=6, 100, 150, 200, and 300 K. Figure 4(a) shows the observed, calculated and difference neutron-diffraction profiles at 200 K for \( La_{2}O_{3}Fe_{2}Se_{2} \) . The pattern can be fit very well by a structural model based on \( La_{2}O_{3}Fe_{2}Se_{2} \) in the space group I4/mmm. The agreement factor for peak intensities is \( R_{B} \) of 0.0562, indicating the high quality of the fit, as does a comparison of the observed and calculated pattern (Fig. 4). A broad diffracted intensity feature is centered around 22°. This is clear evidence for the presence of short-range spin ordering at this temperature, which is consistent with our susceptibility measurements. This broad feature is also observed in the T=300 K neutron spectrum and will be discussed in further detail later. The room-temperature structure parameters for \( La_{2}O_{3}Mn_{2}Se_{2} $ are presented in Table I. A comparison of the structural and physical details for \( La_{2}O_{3}Mn_{2}Se_{2} and La_{2}O_{3}T_{2}Se_{2} \) ( \( T=Fe, Co \) ) is presented in Table II. \( ^{4,5} \) In the \( MnSe_{4}O_{2} \) octahedron, as shown in the inset of Fig. 5, the two
TABLE I. Room-temperature structure details of \( La_{2}O_{3}Mn_{2}Se_{2} \) . \( B_{iso} \) is the isotropic Debye-Waller factors; \( R_{wp} \) and \( R_{ewp} \) are the background subtracted Rietveld R factors; \( R_{B} \) is the Bragg R factor; and \( R_{F} \) is the crystallographic R factor (Ref. 11).
| La2O3Mn2Se2 | ||
| Space group (No. 139) | I4/mmm | |
| a (Å) | 4.13939(3) | |
| c (Å) | 18.8511(2) | |
| Atomic positions | Biso(Å2) | |
| La (4e) | 0.5, 0.5, 0.18684(5) | 0.297(19) |
| Mn (4c) | 0.5, 0, 0 | 0.777(39) |
| Se (4e) | 0, 0, 0.10052(8) | 0.760(21) |
| O(1) (4d) | 0.5, 0, 0.25 | 0.659(25) |
| O(2) (2b) | 0.5, 0.5, 0 | 1.462(46) |
| Agreement indices overall | ||
| Rwp=0.0611 | ||
| Rewp=0.0473 | ||
| Bragg R-factor | RB=0.0562 | |
| RF=0.0395 | ||
Mn-O bond lengths are 2.06 970(2) Å, which is in good agreement with the sum of the radii of Mn^{2+} (0.67 Å) and O^{2-}(1.40 Å); the four Mn-Se bond lengths are 2.8061(10) Å which is about 0.15 Å larger than the sum of their radii. The nearest intralayer Mn-Mn distance is \( d_{1} = 2.92\,699(2) \) Å ( \( a/\sqrt{2} \) ) while the nearest interlayer Mn-Mn distance is \( d_{2} = 9.4256(1) \) Å (c/2). The ratio of \( d_{2}/d_{1} \) is about 3.22; this ratio is 3.22 and 3.20 for Fe and Co analog, respectively. These ratios are much larger than 2.57, the ratio in the 2D antiferromagnet BaNi_{2}V_{2}O_{8},^{19} implying even smaller interlayer spin correlations in La_{2}O_{3}T_{2}Se_{2}. On progressing from Mn to Co, the lattice parameter a monotonically decreases by 1.7% and c linearly increases by 2.3%; the T-O-T bond angles are all 180° while the \( \alpha(T-\mathrm{Se}-T) \) , as shown in the inset of Fig. 5, increases from 95.049° (T = Mn), to 97.040° (T = Fe), to 98.418° (T = Co). As will be described, \( \alpha(T-\mathrm{Se}-T) \) is crucial for the spin interactions in this system.
The neutron-diffraction pattern measured at 6 K is presented in Fig. 4(b). No structural phase transition is observed between 300 and 6 K. The inset of Fig. 4(b) shows a comparison of the spectra taken at 200 and 6 K, between \( 20^{\circ} \) and \( 28^{\circ} \) . Very large extra peaks due to the 3D long-range AFM

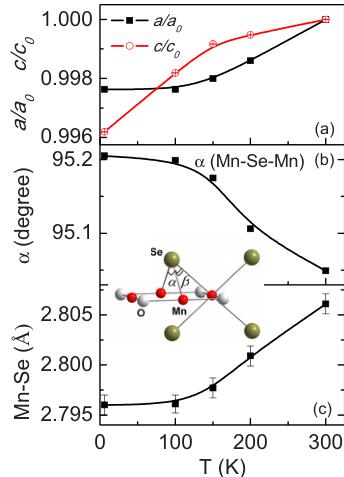
FIG. 5. (Color online) (a) Normalized lattice parameters \( a/a_{0} \) and \( c/c_{0} \) of \( La_{2}O_{3}Mn_{2}Se_{2}~vs~temperature \) , where \( a_{0}=4.13~939(3) \) Å and \( c_{0}=18.8511(2) \) Å (values at 300 K). (b) \( \alpha(T-\mathrm{Se}-T) \) vs T. (c) Mn-Se bond length vs temperature. Inset: the \( [Mn_{2}OSe_{2}]^{2-} \) sheet; two Mn-Se-Mn angles are defined as \( \alpha \) and \( \beta \) , respectively.
ordering are clearly seen at 6 K. A combined magnetic and crystal structure refinement was performed for the diffraction patterns collected at 150, 100, and 6 K; the refined structural and magnetic parameters at 200, 150, 100, and 6 K are summarized in Table III. The temperature dependence of normalized unit-cell parameters \( a/a_{0} \) and \( c/c_{0} \) , with \( a_{0} \) and \( c_{0} \) of the values at ambient temperature, the Mn-Se-Mn bond angle as well as the Mn-Se bond length are plotted in Fig. 5. With increasing temperature, a increases monotonically by 0.2% and c increases by 0.4%. The Mn-Se-Mn bond angle slowly decreases from a 6 K value of \( 95.205^{\circ} \) to \( 95.175^{\circ} \) at 150 K and then rapidly drops to \( 95.049^{\circ} \) at ambient temperature. From 6 to 150 K, the Mn-Se bond length slowly increases from \( 2.7960(10) \) to \( 2.7977(10) \) Å, and then quickly increases to \( 2.8061(10) \) Å. There is a clear change in the a, c, Mn-Se-Mn bond angle and Mn-Se bond length associated with the 3D magnetic ordering transition.
The magnetic structure was determined from the neutron-diffraction pattern taken at 6 K. Magnetic symmetry analysis
TABLE II. Comparison of the structure and physical properties among \( La_{2}O_{3}T_{2}Se_{2} \) [T=Mn, Fe (Ref. 4), and Co (Ref. 5)]. The definition of \( \alpha(T-\mathrm{Se}-T) \) and \( \beta(T-\mathrm{Se}-T) \) is shown in the inset of Fig. 5. The unit of \( d_{T,O} \) , \( d_{T,Se} \) , \( d_{1} \) , and \( d_{2} \) is Å; the unit of \( \alpha(T-\mathrm{Se}-T) \) and \( \boldsymbol{\beta}(T-\mathrm{Se}-T) \) is degree; the unit of \( E_{g} \) is eV; and the unit of \( T_{N} \) and \( T_{max} \) is K.
| d_{T-O} | d_{T-Se} | d_{1} | d_{2} | \alpha(T-Se-T) | \beta(T-Se-T) | E_{g} | T_{N} | T_{max} | |
| T=Mn | 2.06970(2) | 2.8061(10) | 2.92699(2) | 9.4256(1) | 95.049 | 62.871 | 163 | 350 | |
| T=Fe \( {}^{a} \) | 2.0394(1) | 2.7223(12) | 2.8841(1) | 9.324(1) | 97.040 | 63.974 | 0.19 | 93 | 120 |
| T=Co \( {}^{b} \) | 2.0348(4) | 2.6877(9) | 2.8777(4) | 9.2095(20) | 98.418 | 64.735 | 0.35 | 220 | 270 |
\( ^{a} \) Reference 4.
\( ^{b} \) Reference 5.
TABLE III. Chemical and magnetic structure details of \( La_{2}O_{3}Mn_{2}Se_{2} \) at T=200, 150, 100, and 6 K. \( R_{wp} \) and \( R_{evp} \) are the background subtracted Rietveld R factors; \( R_{B} \) is the Bragg R factor; and \( R_{F} \) is the crystallographic R factor (Ref. 11).
| T(K) | ||||
| 200 | 150 | 100 | 6 | |
| Chemical structure | ||||
| a(Å) | 4.13357(3) | 4.13108(3) | 4.12963(3) | 4.12956(3) |
| c(Å) | 18.8412(2) | 18.8354(2) | 18.8169(2) | 18.7793(2) |
| z-La | 0.18660(5) | 0.18642(5) | 0.18648(6) | 0.18651(6) |
| z-Se | 0.10033(8) | 0.10018(8) | 0.10020(7) | 0.10039(8) |
| d_{Mn-O} | 2.06679(2) | 2.06554(2) | 2.06482(2) | 2.06478(2) |
| d_{Mn-Se} | 2.8009(10) | 2.7977(10) | 2.7961(9) | 2.7960(10) |
| \alpha(Mn-Se-Mn) | 95.106 | 95.175 | 95.199 | 95.205 |
| R_{p} | 0.0473 | 0.0504 | 0.0523 | 0.0556 |
| R_{wp} | 0.0602 | 0.0636 | 0.0668 | 0.0721 |
| R_{B} | 0.0496 | 0.0497 | 0.0488 | 0.0531 |
| Magnetic structure | ||||
| M_{z}(\mu_{B}) | 2.170(28) | 3.329(25) | 4.147(28) | |
| R_{B} | 0.174 | 0.0864 | 0.0408 | |
was performed by the BASIREPS program. \( ^{[11]} \) Together with the Rietveld structure refinement, the magnetic reflections, e.g., as shown in the inset of Fig. 4(b) can be well fitted in a magnetic cell that has the same dimensions as the chemical cell with a magnetic propagation vector \( \mathbf{k}=(0,0,0) \) . (The chemical unit cell is \( 2\times \) the area of the \( Mn_{4} \) square in the a-b plane, which is why the magnetic cell is not doubled over the chemical cell in the AFM phase.) The analysis shows \( La_{2}O_{3}Mn_{2}Se_{2} \) , has a G-type AFM structure, as shown in Fig. 6(a), with the ordered magnetic moment along the c direction. The in-plane spins have fourfold symmetry as shown in


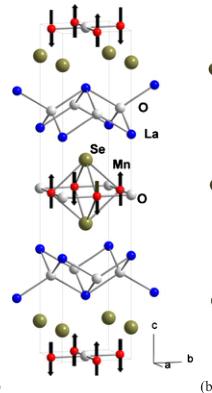
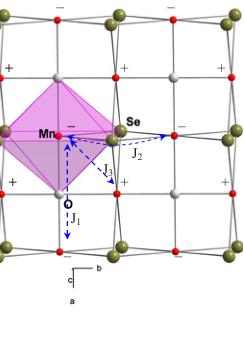
FIG. 6. (Color online) (a) Chemical and magnetic structure of \( La_{2}O_{3}Mn_{2}Se_{2}.\ (b) View of the [Mn_{2}OSe_{2}]^{2-} \) sheet. The three most important exchange interactions are denoted.
Fig. 6(b). The ordered magnetic moment has a value of 4.147(28) \( \mu_{B}/Mn \) at 6 K, 3.329(25) \( \mu_{B}/Mn \) at 100 K, and 2.170(28) \( \mu_{B}/Mn \) at 150 K. The same magnetic structure and similar values of 4.2(1) \( \mu_{B}/Mn \) and 3.88(4) \( \mu_{B}/Mn \) are observed in \( BaMn_{2}P_{2} \) and \( BaMn_{2}As_{2} \) , respectively. \( ^{[20,21]} \) Although the susceptibility data imply the presence of spin canting and spin reorientation in this compound, the available neutron data are not sufficiently sensitive to detect such effects; but given the very small \( M_{0} \) observed in the magnetization measurements, the canting angle must be quite small.
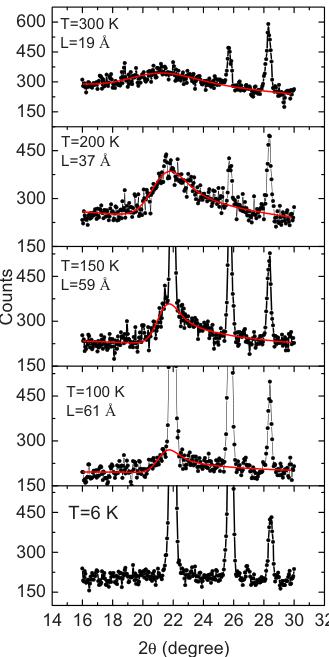
Three main magnetic interactions \( ^{17} \) between \( Mn^{2+} \) ions, as shown in Fig. 6(b), have to be considered among the \( Mn^{2+} \) ions in the \( [T_{2}OSe_{2}]^{2-} \) sheets: the superexchange interaction through the \( 180^{\circ} \) Mn-O-Mn channel, the superexchange interaction through the nearly \( 90^{\circ} \) Mn-Se-Mn channel and the direct exchange interaction between nearest Mn-Mn. These are denoted as \( J_{1} \) , \( J_{2} \) , and \( J_{3} \) , respectively, as shown in Fig. 6(b). Each \( Mn^{2+} \) ion experiences two \( J_{1} \) , two \( J_{2} \) , and four \( J_{3} \) interactions. According to the Goodenough-Kanamori rules, \( ^{22} \) for the \( d^{5}Mn^{2+} \) ion, an AFM ( \( J_{1}<0 \) ) interaction is expected through the \( 180^{\circ} \) Mn-O-Mn superexchange channel while a FM ( \( J_{2}>0 \) ) interaction is expected for the \( 95.205^{\circ} \) Mn-Se-Mn superexchange channel. Therefore the spin arrangement of the next-nearest neighbors depends on the strength of \( J_{1} \) and \( J_{2} \) ; if the Mn-O-Mn superexchange interaction dominates, they will be antiparallel, otherwise, they will be parallel. From the magnetic structure determined for \( La_{2}O_{3}Mn_{2}Se_{2} \) ,in which the nearest-neighbor Mn-Mn possess antiparallel spins while the next-nearest neighbors possess parallel spins, we infer that \( |J_{1}| The neutron powder-diffraction data provide clear evidence for 2D short-range ordering in this compound. Figure 7 shows the enlarged neutron-diffraction pattern between \( 2\theta=16^{\circ} \) and \( 30^{\circ} \) taken at \( T=300, 200, 150, 100, \) and 6 K. At 300 K, a pronounced broad peak characterized by a relatively rapid increase at lower angles and a more gradual decrease at higher angles is centered around \( 2\theta=22^{\circ} \) . This asymmetric peak, characteristic of 2D ordering, \( ^{23} \) becomes sharper in width and larger in magnitude at 200 K. After entering into the ordered state, where the magnetic Bragg peaks are clearly detected at \( 2\theta=22^{\circ} \) and \( 25.7^{\circ} \) , the broad peak can still be observed but with a gradually diminishing magnitude at 150 and 100 K. It finally disappears at 6 K. This clearly demonstrates that the long-range order grows at the expense of the short-range order. The 2D correlation length can be obtained from peak shape analysis. The asymmetric peak is of the Warren shape, which is the characteristic peak shape of 2D correlations. It can be expressed as \( ^{23} \) \[ P_{2\theta}=K m\frac{F^{2}(1+\cos^{2}2\theta)}{2(\sin\theta)^{3/2}}\bigg(\frac{L}{\sqrt{\pi\lambda}}\bigg)^{1/2}W(a), \quad (1) \] where FIG. 7. (Color online) Enlarged neutron powder-diffraction pattern to emphasize the short-range ordering feature. The red solid line is the Warren line shape fit [Eq. (1)]. \[ W(a)=\int_{0}^{\infty}\exp[-(x^{2}-a)^{2}]dx \quad (2) \] and \( a=(2\sqrt{\pi})\lambda(\sin\theta-\sin\theta_{0}) \) , L is the two-dimensional correlation length, K is a constant, m is the two-dimensional \( ^{1} \) Y. Kamihara, T. Watanabe, M. Hirano, and H. Hosono, J. Am. Chem. Soc. 130, 3296 (2008). \( ^{2} \) H. Takahashi, K. Igawa, K. Arii, Y. Kamihara, M. Hirano, and H. Hosono, Nature (London) 453, 376 (2008). \( ^{3} \) J. M. Mayer, L. E. Schneemeyer, T. Siegrist, J. V. Waszczak, and B. Van Dover, Angew. Chem., Int. Ed. Engl. 31, 1645 (1992). \( ^{4} \) J. X. Zhu, R. Yu, H. Wang, L. L. Zhao, M. D. Jones, J. Dai, E. Abrahams, E. Morosan, M. Fang, and Q. Si, Phys. Rev. Lett. 104, 216405 (2010). \( ^{5} \) C. Wang, M. Q. Tan, C. M. Feng, Z. F. Ma, S. Jiang, Z. A. Xu, G. H. Cao, K. Matsubayashi, and Y. Uwatoko, J. Am. Chem. Soc. 132, 7069 (2010). \( ^{6} \) Y. Fuwa, M. Wakeshima, and Y. Hinatsu, J. Phys.: Condens. Matter 22, 346003 (2010). \( ^{7} \) F. C. Hsu, J.-Y. Luo, K.-W. Yeh, T.-K. Chen, T.-W. Huang, P. M. Wu, Y.-C. Lee, Y.-L. Huang, Y.-Y. Chu, D.-C. Yan, and M.-K. multiplicity, and F is the two-dimensional structure factor, which can be taken as a constant over small ranges of angle. A background function expressed as \( B_{0}+B_{1}(2\theta) \) is added to the Warren function in the fitting. The correlation length L, extracted from the above fitting, rises from a room-temperature value of 19 Å which is about three times the in-plane lattice parameter a, to 37 Å at 200 K, and stays around 60 Å (around 12a) at 150 and 100 K, where long-range ordering has been built up. This result is physically reasonable and thus supports the validity of the above analysis. A layered rare-earth manganese oxyselenide insulator, \( La_{2}O_{3}Mn_{2}Se_{2} \) , containing alternating \( [La_{2}O_{2}]^{2+} \) and \( [Mn_{2}OSe_{3}]^{2-} \) sheets, was synthesized and characterized by susceptibility, heat-capacity, and neutron powder-diffraction measurements. This compound undergoes an AFM phase transition at 163 K with a G-type antiferromagnetic structure, and small amount of spin canting, leading to the presence of a weak spontaneous magnetization. The ordered magnetic moment is along the c direction, with a value of \( 4.147(28)\mu_{B}/Mn \) at 6 K. Above 163 K, 2D short-range ordering is inferred from a broad maximum centered at 350 K in susceptibility, a very faint specific-heat anomaly, and a Warren-type broad peak in the neutron spectra. A small structural distortion appears to accompany the 3D magnetic ordering, though the symmetry of the average structure is unchanged. The authors would like to thank S. Dutton, M. Bremholm, E. Morosan, J. Xiong, N. P. Ong, and J. M. Allred for helpful discussions. The work at Princeton was supported by the AFOSR MURI on superconductivity. Wu, Proc. Natl. Acad. Sci. U.S.A. 105, 14262 (2008). \( ^{8} \) T. M. McQueen, A. J. Williams, P. W. Stephens, J. Tao, Y. Zhu, V. Ksenofontov, F. Casper, C. Felser, and R. J. Cava, Phys. Rev. Lett. 103, 057002 (2009). \( ^{9} \) H. Wu, Phys. Rev. B 82, 020410(R) (2010). \( ^{10} \) D. G. Free and J. S. O. Evans, Phys. Rev. B 81, 214433 (2010). \( ^{11} \) J. Rodríguez-Carvajal, Physica B 192, 55 (1993). \( ^{12} \) J. E. Greedan, N. P. Raju, and I. J. Davidson, J. Solid State Chem. 128, 209 (1997). \( ^{13} \) S. Chikazumi, Physics of Ferromagnetism (Oxford University Press, New York, 1997). \( ^{14} \) I. Dzyaloshinsky, J. Phys. Chem. Solids 4, 241 (1958); T. Moriya, Phys. Rev. 120, 91 (1960). \( ^{15} \) S. Maekawa, T. Tohyama, S. E. Barnes, S. Ishihara, W. Koshibae, and G. Khaliullin, Physics of Transition Metal Oxides, Springer Series in Solid State Sciences Vol. 144 (Springer- Verlag, Berlin, 2004). \( ^{16} \) D. R. Smith and F. R. Fickett, J. Res. Natl. Inst. Stand. Technol. 100, 119 (1995). \( ^{17} \) H. Kabbour, E. Janod, B. Corraze, M. Danot, C. Lee, M.-H. Whangbo, and L. Cario, J. Am. Chem. Soc. 130, 8261 (2008). \( ^{18} \) R. Navarro, in Magnetic Properties of Layered Transition Metal Compounds, edited by L. J. de Jongh (Kluwer Academic, Dordrecht, 1990). \( ^{19} \) N. Rogado, Q. Huang, J. W. Lynn, A. P. Ramirez, D. Huse, and R. J. Cava, Phys. Rev. B 65, 144443 (2002). \( ^{20} \) S. L. Brock, J. E. Greedan, and S. M. Kauzlarich, J. Solid State Chem. 113, 303 (1994). \( ^{21} \) Yogesh Singh, A. Ellern, and D. C. Johnston, Phys. Rev. B 79, 094519 (2009). \( ^{22} \) J. B. Goodenough, Phys. Rev. 100, 564 (1955); J. Phys. Chem. Solids 6, 287 (1958). \( ^{23} \) B. E. Warren, Phys. Rev. 59, 693 (1941).

IV. CONCLUSION
ACKNOWLEDGMENTS
 p2_0.jpg
 p2_1.jpg
 p2_2.jpg
 p3_0.jpg
 p4_0.jpg
 p5_0.jpg
 p5_1.jpg
 p6_0.jpg