| Transition Temperature | 80 K |
|---|---|
| Experiment Temperature | 2 K |
| Propagation Vector | k1 (0, 0, 0) |
| Parent Space Group | P21/c (#14) |
| Magnetic Space Group | P21'/c' (#14.79) |
| Magnetic Point Group | 2'/m' (5.5.16) |
| Lattice Parameters | 5.21683(6) 5.56803(6) 7.44896(9) 90.00 89.760(1) 90.00 |
|---|---|
| DOI | 10.1103/physrevb.93.214401 |
| Reference | J. Blasco, J. Garcia, G. Subias, J. Stankiewicz, J.A. Rodriguez-Velamazan, C. Ritter, J.L. Garcia-Munoz and F. Fauth, Physical Review B (2016) 93. |
| Label | Element | Mx | My | Mz | |M| |
|---|---|---|---|---|---|
| Co1 | Co | 0.85 | 0.33 | -2.78 | 2.92 |
| Mn1 | Mn | 0.85 | 0.33 | -2.78 | 2.92 |
Magnetoelectric and structural properties of \( Y_{2}CoMnO_{6} \) : The role of antisite defects
J. Blasco,\(^{1,*}\) J. García,\(^{1}\) G. Subías,\(^{1}\) J. Stankiewicz,\(^{1}\) J. A. Rodríguez-Velamazán,\(^{1,2}\)
C. Ritter, \( ^{2} \) J. L. García-Muñoz, \( ^{3} \) and F. Fauth \( ^{4} \)
\( ^{1} \) Instituto de Ciencia de Materiales de Aragón, Departamento de Física de la Materia Condensada,
Consejo Superior de Investigaciones Científicas (CSIC)–Universidad de Zaragoza, E-50009 Zaragoza, Spain
\( ^{2} \) Institut Laue Langevin (ILL), 71, Avenue des Martyrs, 38042 Grenoble Cedex, France
\( ^{3} \) Institut de Ciência de Materiales de Barcelona, ICMAB-CSIC, Campus de la Universidad de Bellaterra, E-08193 Bellaterra, Spain \( ^{4} \) CELLS-ALBA Synchrotron Light Facility, Carretera BP1413 km 3.3, 08290 Cerdanyola del Vallès, Barcelona, Spain (Received 15 March 2016; revised manuscript received 9 May 2016; published 1 June 2016)
We have carried out an investigation on the magnetoelectric properties of the presumed multiferroic \( Y_{2}CoMnO_{6} \) with different degrees of Co/Mn atomic ordering. The magnetic ground state was studied by neutron diffraction, showing a collinear ferromagnetic (FM) ordering of Co and Mn moments with a small antiferromagnetic canting. No superstructure peaks from an E-type magnetic structure were detected in our measurements. Magnetic measurements reveal FM transitions with pinned magnetic domains. The degree of Co/Mn ordering affects the Curie temperature only a little, but has strong effects on the magnetic hysteresis loops, and the FM moment signal at high field increases with increasing such order. The loops display steps at critical fields whose number and extent depends on each specimen. The most ordered sample exhibits the greatest steps ascribed to the alignment of magnetic domains separated by antiphase boundaries. All samples are insulators exhibiting low dielectric loss and dielectric constants at low temperature. On warming, they show a step increase in the real dielectric permittivity accompanied by peaks in the dielectric loss typical of thermally activated hopping processes. At room temperature, the huge values of the dielectric constant reveal the presence of Maxwell-Wagner depletion layers. Pyroelectric measurements reveal a high polarization at low temperature for these compounds that increases with increasing the Co/Mn ordering. There is no correlation between the magnetic transition and the onset of pyroelectric current. No significant changes are observed in the pyroelectric effect measured under an external magnetic field, so magnetoelectric coupling is negligible. This paper identifies the pyroelectric current as thermally stimulated depolarization current ascribed to the reorientation of defect dipoles with activation energy of about 0.05 eV. Therefore, no ferroelectric transition occurs in these compounds, discarding the existence of intrinsic magnetoelectric multiferroicity.
DOI: 10.1103/PhysRevB.93.214401
I. INTRODUCTION
In recent years, there has been great interest in finding new multifunctional materials with magnetoelectric coupling due to their promising applications \( [1,2] \) . This interest has led to the exploration of new mechanisms to promote such a coupling. In this way, first principles density functional theory calculations predicted an E-type magnetic ground state for \( Y_{2}MnNiO_{6} \) double perovskite \( [3] \) . This magnetic arrangement, previously found in some manganites, breaks symmetry center and allows a ferroelectric polarization perpendicular to \( \uparrow\uparrow\downarrow\downarrow \) spin chains as the magnetic ordering induces cooperative shifts of oxygen atoms perpendicular to M-M (M = Mn or Ni) path in order to minimize the elastic energy \( [4,5] \) . The coexistence of electric and magnetic orderings classified these compounds as improper multiferroics \( [6] \) . The above-mentioned calculations motivated an extensive investigation in the field of double perovskites to find new multiferroic materials. Neutron diffraction measurements identified the E-type magnetic order in \( Lu_{2}CoMnO_{6} \) \( [7] \) and more recently in \( Yb_{2}CoMnO_{6} \) \( [8] \) although there is controversy about their multiferroic properties \( [7-9] \) .
In addition, there has also been a reinvestigation of known systems very related to \( Y_{2}NiMnO_{6} \) as, e.g., the isostructural compound \( Y_{2}CoMnO_{6} \) . Recent reports claim that this compound undergoes a ferroelectric transition at 80 K driven by an E-type magnetic ordering [10]. The main evidence is the existence of a reversible pyroelectric current, and the corresponding electrical polarization has its onset at temperatures close to the magnetic transition temperature. Moreover, the report of a partial suppression of the electric polarization after applying a magnetic field of 5 T suggests a significant magnetoelectric coupling. This report is supported by first principle calculations that yield a magnetic ground state composed by an E-type order in competition with ferromagnetic (FM) and A-type antiferromagnetic (AFM) orderings [11]. An electric polarization of \( \sim4700\muC m^{-2} \) is calculated, but this value is almost two orders of magnitude higher than the experimental data obtained from pyroelectric measurements [10]. However, there is no clear experimental evidence that \( Y_{2}CoMnO_{6} \) adopts an E-type magnetic ordering, and it contradicts other works that claim a different ordering [12–14]. A study in the \( YMn_{1-x}Co_{x}O_{3} \) series [12] indicated that \( YMnO_{0.5}Co_{0.5}O_{3} \) exhibits a partial Mn/Co ordering (around 75%) and a collinear FM ordering similar to the one found in \( La_{2}CoMnO_{6} \) or \( Tb_{2}CoMnO_{6} \) [15,16]. Accordingly, a recent magnetic study of \( Y_{2}CoMnO_{6} \) also reports a collinear FM ordering [13], though the refinements of the neutron patterns suggest a significant number of antisite defects (ASDs), i.e., Mn and Co exchange positions. Finally, another recent neutron study suggests a phase segregation scenario in an \( Y_{2}CoMnO_{6} \) .
specimen that contains an ordered monoclinic phase with ASDs coexisting with a fully disordered orthorhombic phase. Only the former exhibits a FM order \( [14] \) . These works highlighted a very important property of double perovskites, the occurrence of ASDs that can modify significantly the physical properties of a material including its magnetic ground state. The theoretical calculations previously mentioned were performed for ideal materials with a perfect cationic arrangement so different ratios of ASDs may account for the different results obtained in the studies of this system. Unfortunately, no information about the ASDs is given in Ref. \( [10] \) for the sample showing the E-type structure. Another contradiction arises when this result is compared with those published for isostructural compounds. It is well known that E-type structures occur for double perovskites having a small cation in the A position because the strong structural distortion favors competitive magnetic interactions combining a small short FM nearest-neighbor exchange coupling and a large AFM next-nearest-neighbor interaction \( [17] \) . According to Ref. \( [10] \) , \( Y_{2}CoMnO_{6} \) , with \( Y^{3+}(r=1.075\mathring{A}) \) \( [18] \) in the A position, develops an E-type ordering so compounds with smaller atoms in this position should show similar magnetic structure. This is the case for Yb- and Lu-based compounds (r=1.042 and 1.032 Å, respectively) \( [18] \) , but not for other \( R_{2}CoMnO_{6} \) compounds (R=Ho, Tm, or Er), where the cationic radius of the A atom ranges between \( [18] \) 1.072 and 1.052 Å and the conventional FM ordering is found \( [19] \) .
With the aim of giving definitive answers to the magnetic ground state of \( Y_{2}CoMnO_{6} \) and the role of ASDs in its physical properties, especially the multiferroic properties, we have carried out a revision of the magnetic structure by means of neutron diffraction and a simultaneous characterization of its structural, magnetic, and dielectric properties.
II. EXPERIMENTAL
Three different \( Y_{2}CoMnO_{6} \) compounds were prepared by the solid-state chemistry method. Stoichiometric amounts of \( Y_{2}O_{3}, Co_{3}O_{4} \) , and \( Mn_{2}O_{3} \) with nominal purities not less than 99.9% were mixed, ground, and heated overnight at \( 900^{\circ}C \) . They were then ground again, pressed into pellets, and sintered at \( 1050^{\circ}C \) in air for 1 d. The pellets were reground, repressed, and sintered at \( 1250^{\circ}C \) for 2 d, followed by different cooling conditions depending on each specimen. The sample denoted as Q was prepared by quenching of the pellet into air. The samples M and S were prepared by cooling at \( 5^{\circ}C min^{-1} \) and at \( 0.1^{\circ}C min^{-1} \) down to \( 300^{\circ}C \) before the samples were extracted from the furnace. It is well known that slow cooling improves the cationic ordering at the perovskite B site and the oxygen stoichiometry [20,21]. The chemical composition of the samples was tested by using the wavelength dispersive x-ray fluorescence spectrometry technique. The cationic composition agreed with the nominal one for all samples within the experimental error (see Table S1 in the Supplemental Material [22]).
Standard x-ray powder diffraction patterns were collected at room temperature using a Rigaku D/Max-B instrument with a copper rotating anode and a graphite monochromator to select the \( CuK_{\alpha} \) wavelength. The device was working at 40 kV and 100 mA, and the measurements were performed in step-scanned mode from \( 18^{\circ} \leqslant 2\theta \leqslant 135^{\circ} \) in steps of \( 0.03^{\circ} \) , with a counting rate of 6 s/step. Synchrotron x-ray powder diffraction measurements were performed at the MSPD beamline of the ALBA synchrotron [23]. The samples were loaded in a borosilicate glass capillary (diameter of 0.5 mm) and kept spinning during data acquisition. A short wavelength \( \lambda = 0.4137 \) Å was selected to minimize absorption. The value of \( \lambda \) was calibrated using National Institute of Standards and Technology (NIST) standard silicon. The patterns were collected between 10 and 150 K using a He flow cryostat (Dynaflow). The acquisition time just necessary to refine unit cells was about 30 min for an effective range of \( 1^{\circ} \leqslant 2\theta \leqslant 30^{\circ} \) in steps of \( 0.003^{\circ} \) . Neutron diffraction experiments were carried out at different temperatures at the high-flux reactor of the ILL, using two instruments. The high intensity diffractometer D1B was used to collect thermodiffractograms from 2 K up to temperatures well above the magnetic ordering. The device was working with a wavelength of \( 2.52 \) Å covering a useful angular range \( 5^{\circ} \leqslant 2\theta \leqslant 128^{\circ} \) . The high resolution powder diffractometer D2B ( \( \lambda = 1.5914 \) Å) was used to perform crystallographic studies at selected temperatures. Structural refinements were made of both x-ray and neutron diffractograms by using the FullProf program [24].
Magnetic measurements were carried out between 2 and 300 K by using commercial Quantum Design [superconducting quantum interference device (SQUID) and Physical Property Measurement System (PPMS)] magnetometers. The dielectric measurements were carried out as a function of temperature between 5 and 300 K in a He cryostat employing a homemade coaxial-line inset. A sintered disc with diameter of 7.9 mm and thickness of 0.85 mm was used. Silver paint was applied to the disc surface for proper electrical contact. The complex dielectric permittivity of the samples was measured using an impedance analyzer (Wayne Kerr Electronics 6500B), applying voltages with an amplitude of 1 V and a frequency range between 10 Hz and 5 MHz. Polarization versus electric-field loops were recorded using a commercial polarization analyzer (aixACCT Systems Easy Check 300) for frequencies up to 250 Hz and electric-field amplitude of a few kilovolts per centimeter.
Pyroelectric current was measured with a Keithley 2635B electrometer by warming the sample at a constant rate with values ranging between 0.5 and 10 K min \( ^{-1} \) . The change in the electrical polarization was obtained by integrating the pyroelectric current as a function of time. Different poling fields were tested. The electric field was applied at 150 K, followed by cooling at a rate of 10 K m \( ^{-1} \) down to 5 K. Then the field was removed, and the stabilization of the polarization was reached after shorting the circuit for 15 min to remove surface charges.
III. RESULTS AND DISCUSSION
A. Crystal structure at room temperature
The x-ray powder diffraction patterns of \( Y_{2}CoMnO_{6} \) compounds at room temperature agree with a single-phase perovskite. In fact, the observed diffraction peaks can be indexed in the \( P2_{1}/n \) space group, which is one of the most common distorted structures for a double perovskite exhibiting cationic ordering on the B site (nominal formula \( A_{2}BB'O_{6} \) ). Accurate Rietveld refinements can be obtained using this

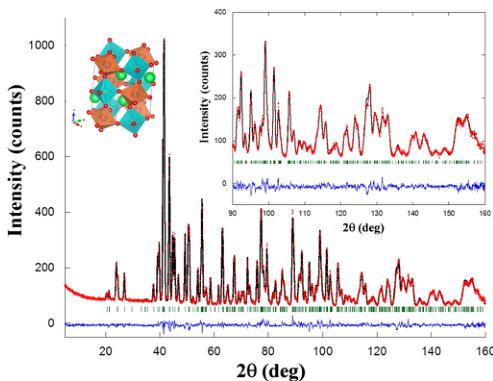
FIG. 1. Rietveld refinement of the neutron powder pattern of \( Y_{2}CoMnO_{6} \) (S sample) at 300 K. Points and line stand for experimental and calculated intensities, respectively. The difference is plotted at the bottom, and the row of bars indicates allowed reflections. The pattern was measured at D2B ( \( \lambda = 1.5914 \) Å), and according to [Ref. [24]], the reliability factors (%) are \( R_{wp} = 4.0 \) , \( R_{Bragg} = 3.3 \) , and \( \chi^{2} = 3.1 \) . Inset: (left) Polyhedral picture of the crystal structure. Big and small balls stand for Y and O atoms, respectively, while brown and blue octahedra refer to \( CoO_{6} \) and \( MnO_{6} \) (online); (right) detail of the same refinement at high angle (low q) region.
structural model (not shown here) and the cationic ordering can be inferred from the different interatomic bond lengths for the two \( BO_{6} \) octahedra. However, the exact Co/Mn distribution on both crystallographic sites is hardly disclosed by x-ray powder diffraction since both cations have similar scattering factors [25]. Therefore, neutron diffraction is more appropriate to determine the right Co/Mn distribution as Mn and Co neutron scattering lengths are even opposite in sign [26]. The structural study will be focused on the most perfectly ordered S sample with occasional references to the other compounds to highlight the role of ASDs. Figure 1 shows the refinement of the neutron pattern collected at room temperature using the D2B instrument for the S sample, whereas Table 1 shows the structural parameters obtained from such a refinement. The refinement of the Co/Mn occupancies in the B sublattice confirms a high ordering degree of around 92% for the S specimen, so the ASD is \( \sim8\% \) (it is noteworthy that 50% means random Co/Mn distribution). The interatomic Co-O and Mn-O distances are very close to the ones expected for \( Co^{2+}-O \) and \( Mn^{4+}-O \) , respectively [18]. This result is in agreement with the ground valence state derived from x-ray absorption near edge structure (XANES) spectroscopy, with a prevailing \( Co^{2+}/Mn^{4+} \) configuration, in related double perovskites [21,27]. However, the bond valence sum (BVS) method yields an average valence of \( Co^{2.28+} \) and \( Mn^{3.85+} \) , suggesting that Co is overbonded while Mn is underbonded in this crystal structure. This strain may mirror the presence of the mentioned ASD. Overall, the structural parameters reflect a distortion from the aristotype cubic structure due to the small size of \( Y^{3+} \) to support a 12-fold coordination with surrounded O-atoms. The consequent strain is relaxed TABLE I. Refined lattice parameters, ASDs (% of Mn atoms located at the Co site and vice versa), fractional atomic coordinates, isotropic temperature factor, and the reliability factors (see Ref. [24]) obtained from the fit of neutron diffraction patterns for \( Y_{2}CoMnO_{6} \) (specimen S) at the indicated temperatures. The space group is \( P2_{1}/n \) (No. 14), and the atoms are located at the following Wyckoff positions: Y, O1, O2, and O3 at \( (4e) \) x, y, z; Co at \( (2d) \) \( \frac{1}{2}, 0, 0 \) ; and Mn at \( (2c) \) 0, \( \frac{1}{2}, 0 \) .
| T (K) | 2 | 300 |
| Lattice. a (Å) | 5.21683(6) | 5.22339(6) |
| b (Å) | 5.56803(6) | 5.57082(5) |
| c (Å) | 7.44896(9) | 7.46103(8) |
| β (deg) | 89.760(1) | 89.762(1) |
| Volume (Å3) | 216.371(4) | 217.103(4) |
| Coordinates. Y: x | 0.0193(2) | 0.0183(2) |
| y | 0.0729(2) | 0.0722(2) |
| z | 0.2512(3) | 0.2508(2) |
| B (Å2) | 0.12(2) | 0.64(2) |
| Co: B (Å2) | 0.41(14) | 1.22(17) |
| Mn: B (Å2) | 0.42(8) | 0.81(9) |
| ASD (%) | 8.2(6) | 8.2(6) |
| O1: x | 0.2986(4) | 0.2985(4) |
| y | 0.3154(4) | 0.3153(4) |
| z | 0.0515(3) | 0.0512(3) |
| B(Å2) | 0.18(4) | 0.73(3) |
| O2: x | 0.3197(4) | 0.3186(3) |
| y | 0.2924(4) | 0.2934(4) |
| z | 0.4443(3) | 0.4441(3) |
| B(Å2) | 0.31(4) | 0.76(4) |
| O3: x | 0.6059(3) | 0.6060(2) |
| y | 0.9661(3) | 0.9654(3) |
| z | 0.2557(3) | 0.2564(3) |
| B(Å2) | 0.26(3) | 0.74(3) |
| Mn-Co moment, μx(μB) | 0.85(6) | - |
| μy(μB) | 0.33(3) | - |
| μz(μB) | 2.78(2) | - |
| μl(μB) | 2.92(2) | - |
| Bond lengths. Co-O1 (Å) | 2.081(2) | 2.083(2) |
| Co-O2 (Å) | 2.070(2) | 2.064(2) |
| Co-O3 (Å) | 1.994(2) | 2.003(2) |
| {Co-O}av(Å) | 2.048(2) | 2.050(2) |
| Co-valence (BVS) | +2.30(1) | +2.28(1) |
| Mn-O1 (Å) | 1.907(2) | 1.908(2) |
| Mn-O2 (Å) | 1.926(2) | 1.936(2) |
| Mn-O3 (Å) | 1.909(2) | 1.907(2) |
| {Mn-O}av(Å) | 1.914(2) | 1.917(2) |
| Mn-valence(BVS) | +3.88(1) | +3.85(1) |
| Bond angles. {Co-O1-Mn} (deg) | 146.10(9) | 146.19(9) |
| {Co-O2-Mn} (deg) | 145.34(9) | 145.30(8) |
| {Co-O3-Mn} (deg) | 145.17(9) | 145.08(9) |
| {Co-O-Mn}av(deg) | 145.54 | 145.52 |
| RB(%) | 3.94 | 3.15 |
| Rmag(%) | 3.28 | - |
| Rwp(%) | 3.93 | 2.97 |
| χ2 | 1.72 | 1.74 |

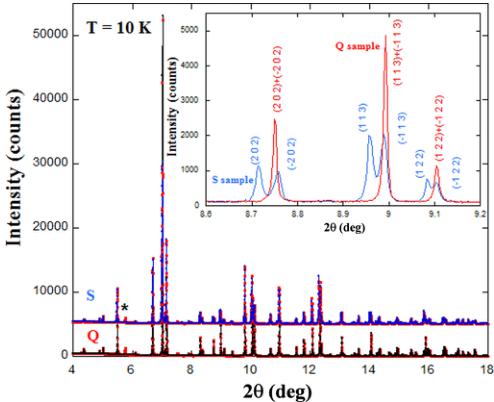
FIG. 2. Rietveld refinement of high resolution x-ray powder diffraction patterns of \( Y_{2}CoMnO_{6} \) (Q and S samples) at 10 K. Points and line stand for experimental and calculated intensities, respectively. Data for S sample is shifted upward for comparison. Asterisk indicates the main spurious contribution from the cryostat. Inset: Detail of the comparison between x-ray patterns of both samples, evidencing the difference in the splitting of some peaks.
by cooperative tilts of \( BO_{6} \) octahedra giving rise to B-O-B' angles (B, \( B' = Co \) , Mn) much smaller than \( 180^{\circ} \) (value for a cubic perovskite).
X-ray powder diffraction using synchrotron radiation with its very high angular resolution was additionally employed to verify its single-phase nature (in contrast with the coexistence of monoclinic and orthorhombic regions in the sample of Ref. [14]). Figure 2 compares the patterns obtained for S and Q samples at 10 K. Both samples are very crystalline as the respective diffraction peaks show the typical instrumental width. This fact also discards a multiphase contribution to the patterns. The main difference between both samples is a significant reduction of the monoclinic distortion for the quenched sample ( \( \beta = 89.984^{\circ} \) and \( 89.719^{\circ} \) for Q and S samples, respectively). The inset of Fig. 2 shows this difference in the splitting of selected peaks. Nevertheless, the fit using a monoclinic model works much better than the refinements using a fully disordered orthorhombic cell. Refinements of neutron patterns are in agreement with these results and reveal a higher degree of ASD, coupled to the reduction of monoclinic distortion, for the Q sample. The refined occupancy for the majority of cations in B sites for this sample is around \( 53.7(20)\% \) , i.e., very close to a random distribution (50%). Again, the fit with a monoclinic single phase is better, suggesting a small ordering rate even for the Q sample. Finally, the M sample shows intermediate values with an ordering degree of \( 79(1)\% \) , very similar to the value reported in the sample of Ref. [12].
B. Magnetic ground state
Neutron patterns were also acquired at 2 K in D2B to refine the magnetic structure. The comparison of the patterns

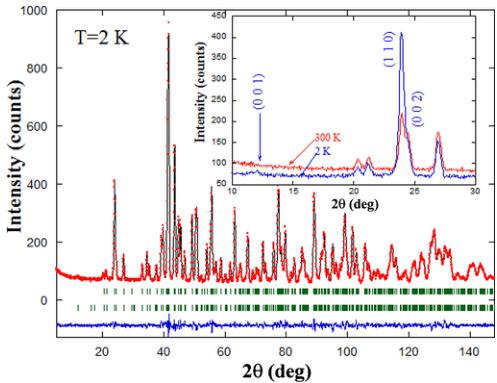
FIG. 3. Rietveld refinement of the neutron powder pattern of \( Y_{2}CoMnO_{6} \) (S sample) at 2 K. Points and line stand for experimental and calculated intensities, respectively. The difference is plotted at the bottom, and the two rows of bars indicate allowed nuclear and magnetic reflections. Inset: Detail of the comparison between the neutron patterns acquired at 300 and 2 K in the same compound, indicating the reflections with magnetic contribution.
collected at room temperature and at 2 K is shown in the inset of Fig. 3. A clear FM contribution is evidenced by the growth of (110) and (002) reflections. The strong increase of the former indicates that the FM contribution mainly lies along the z direction. With the above FM contribution, the occurrence of a weak peak indexed as (001) indicates a weak AFM contribution of the A type located in the xy plane. The magnetic contribution follows a propagation vector \( k = 0 \) , excluding an E-type ordering, which usually follows a propagation vector \( \mathbf{k} \sim (0, 0, \frac{1}{2}) \) in related double perovskites [7,8].
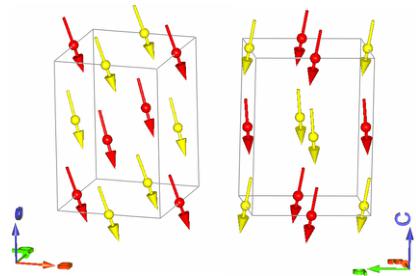
In order to fit the magnetic contribution in the neutron patterns, the best agreement with the experimental results is obtained for a \( (F_{x}, A_{y}, F_{z}) \) magnetic structure, according to Bertaut's notation [28]. The magnetic arrangement can also be explained by symmetry analysis. It belongs to the irreducible representation \( \Gamma_{3} \) (see the Supplemental Material [22] that corresponds to the Shubnikov group \( P2_{1}^{\prime}/n^{\prime} \) ). Our result indicates a FM coupling between Mn and Co atoms in the ac plane in agreement with some earlier reports and with related double perovskites [12–16]. An AFM component is refined in the y axis to account for the weak AFM contribution. The magnetic refinements become very stable and robust when the same magnetic moment is assumed for both atoms. This is expected if both cations, \( Co^{2+} \) and \( Mn^{4+} \) , are in high spin state with S = 3/2. Figure 3 shows the experimental fit and the refined data are summarized in Table I. The refined magnetic moment at 2 K is \( 2.92(2)\mu_{B} \) atom \( ^{-1} \) , which is very close to a fully polarized B sublattice ( \( 3\mu_{B} \) for both atoms in a high spin state). Summarizing these results, this paper discards the occurrence of an E-type magnetic ordering for \( Y_{2}CoMnO_{6} \) with near 92% of perfect cation ordering, which shows instead a collinear FM structure (essentially along z direction) with a

FIG. 4. Two views of the magnetic order in \( Y_{2}CoMnO_{6} \) showing the ferromagnetism in the ac plane (left) and the A-type AFM ordering in the b component (right). Co and Mn are colored in yellow and red, respectively (online).
small AFM component along the y direction, as can be seen in Fig. 4.
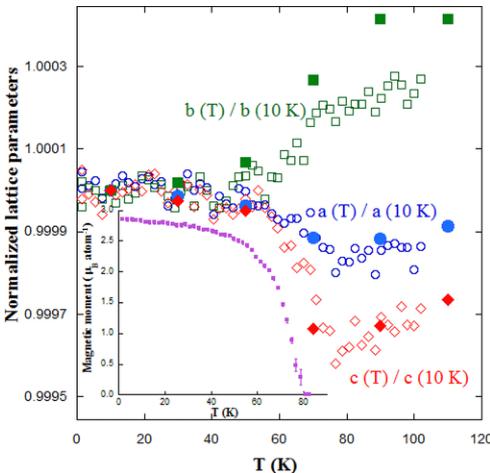
The temperature dependence of structural parameters and the onset for long-range magnetic ordering were determined using the data from D1B. The results are displayed in Fig. 5. Concurrent with the long-range ordering at the Curie temperature \( T_{C} \sim 80 \) K (see inset of Fig. 5), we observe changes in the unit cell. For the sake of comparison, the experimental lattice parameters were normalized to the value obtained at 10 K. The plot reveals that \( Y_{2}CoMnO_{6} \) exhibits an anisotropic magnetostriction at the magnetic transition. Whereas the b axis displays the typical contraction on cooling, the other two axes undergo a sudden expansion at \( T_{C} \) . This expansion seems

FIG. 5. Temperature dependence of the normalized lattice parameters at 10 K for the \( Y_{2}CoMnO_{6} \) (S sample). Open symbols refer to the data obtained from the refinements of D1B data, whereas solid symbols stand for data extracted from high resolution x-ray patterns. Inset: Temperature dependence of the refined magnetic moment per Co/Mn atom.

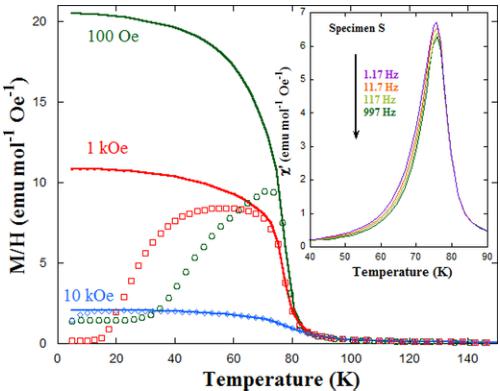
FIG. 6. Zero-field-cooled (symbols) and field-cooled (lines) dc molar susceptibility (M/H) as a function of temperature under magnetic fields of 100, 1000, and 10 000 Oe for \( Y_{2}CoMnO_{6} \) (S sample). Inset: The temperature dependence of ac susceptibility for the same sample at six different frequencies of the magnetic field applied ( \( h_{0} = 4 Oe \) ).
to be related to the direction of the magnetic moment, and accordingly, its magnitude is stronger for the c axis. Though the angular resolution of D1B is poor and artifacts in the refinements coming from the magnetic contribution cannot be discarded, we have confirmed this anisotropic behavior at \( T_{C} \) by additional measurements with synchrotron x-ray powder diffraction, whose results are also reproduced in Fig. 5.
C. Magnetic properties
Magnetic measurements also reveal the occurrence of a magnetic transition in \( Y_{2}CoMnO_{6} \) with decreasing temperature. Figure 6 displays the temperature dependence of the dc magnetization for the S specimen under different magnetic fields in zero-field-cooled (ZFC) and field-cooled (FC) conditions. These measurements show a strong irreversibility, especially at low fields. At 100 Oe, the ZFC curve has an asymmetric peak at about 71 K, whereas the FC branch shows the usual shape of a FM transition. The calculated \( T_{C} \) from the inflection point is 76 K, and the onset of the transition is about 86 K. The temperature range for the ZFC/FC irreversibility decreases with increasing the external field, and the ZFC curve exhibits a broad bump for H = 1 kOe, while ZFC and FC branches are almost superposed for H = 10 kOe. This behavior is tentatively ascribed to the dynamics of magnetic domain walls as long-range FM ordering was clearly observed by neutron diffraction. However, a contribution from the magnetic anisotropy related to the temperature dependence of coercivity cannot be discarded. The magnetic transition was also characterized with ac magnetic susceptibility using different frequencies of the alternating field with amplitude of 4 Oe. The temperature dependence of the real part of the ac susceptibility \( \chi_{ac}^{\prime} \) is shown in the inset of Fig. 6. Here, \( \chi_{ac}^{\prime} \) shows a peak at \( T_{C} \) without significant frequency shift. The only dynamic behavior is a small decrease of the peak

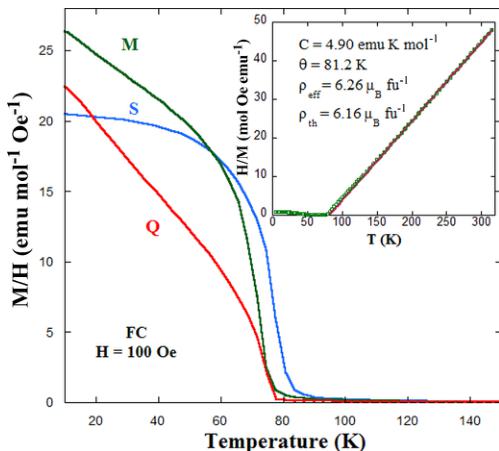
FIG. 7. Field-cooled dc molar susceptibility (M/H) as a function of temperature under a magnetic field of 100 Oe for the three samples of \( Y_{2}CoMnO_{6} \) . Inset: The temperature dependence of the inverse of dc susceptibility (squares) and the fit to a Curie-Weiss law at high temperature (line) for the S specimen. The applied magnetic field is 100 Oe. The results of the fit and theoretical effective paramagnetic moment are given in the plot.
intensity with increasing frequency, and it could be ascribed to magnetic disaccommodation effect of pinned domain walls as reported in alloys [29] and related perovskites [30]. Comparing various specimens, we observe significant differences related to the ASD of the sample (see the Supplemental Material [22]). Overall, with increasing ASD, the \( \chi_{ac}^{\prime} \) peak becomes narrower, less intense, and its dependence on the frequency increases. This result points toward a close relationship between ASDs and magnetic domain boundaries.
On the other hand, the details of the synthesis affect only weakly the value of \( T_{C} \) , as can be seen in Fig. 7. The calculated values from the inflection point are \( T_{C} = 72 \) and 71 K for M and Q specimens, i.e., a decrease of only about 5 K between the samples with almost perfect Co/Mn order (S sample) and almost random distribution (Q sample). The inverse of magnetic susceptibility is linear at high temperatures for all samples. An example is shown in the inset of Fig. 7, and the fitting of this linear part with the Curie-Weiss law \( 1/\chi_{\mathrm{dc}} = (T - \theta)/C \) yields the parameters summarized in Table II. The three samples exhibit similar paramagnetic effective moments ( \( \rho_{eff} \) ), slightly higher than

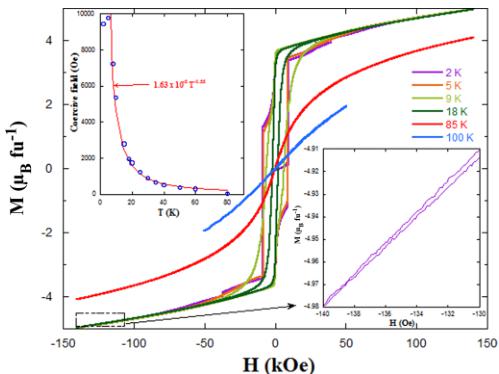
FIG. 8. Magnetic hysteresis cycles of \( Y_{2}CoMnO_{6} \) (S specimen) at the indicated temperatures. Top inset: Temperature dependence for the coercive field for the same sample. The line stands for the power law indicated. Bottom inset: Detail of the loop at high fields indicated by the area of the rectangle.
theoretically calculated considering a spin-only contribution from \( \mathrm{Mn}^{4+}(3.87\;\mu_{\mathrm{B}}) \) and experimental value of \( \mathrm{Co}^{2+}(4.8\;\mu_{\mathrm{B}}) \) , as the latter cation usually shows a partial angular component [31]. All fits reveal a positive Weiss constant ( \( \theta \) ) in agreement with predominant FM correlations in the paramagnetic regime. The Weiss constant strongly decreases with increasing the Mn/Co cation disorder in the sample, suggesting that such a disorder is detrimental for the FM interactions.
Hysteresis loops were measured at selected temperatures in the field range \( -140\ kOe \leqslant H \leqslant 140\ kOe \) and are shown in Fig. 8. The \( M(H) \) data measured at 18 K exhibit a typical FM hysteresis loop with a coercive field ( \( H_{C} \) ) of 1933 Oe. However, magnetic saturation is not achieved even at very high magnetic fields (140 kOe). Moreover, below 20 K, the magnetization value at the highest field ( \( \sim5\ \mu_{B}\ f.u.^{-1} \) ) does not vary significantly with decreasing temperature. The most important change observed in the loops with decreasing temperature is a strong increase in \( H_{C} \) . The inset of Fig. 7 shows the temperature dependence of \( H_{C} \) , and we found that it follows a power law, \( H_{C} \propto T^{-\sim3/2} \) , between 8 K \( \leqslant T \leqslant 75 \) K. Below 8 K, \( H_{C} \) seems to saturate at a value of \( \sim9600 \) Oe. The striking point is the occurrence of strong jumps in the loops. These jumps or steps were reported to depend on the field sweep rate and field-cooling conditions [14,32]. Specifically, the steps in a nominal \( Y_{2}CoMnO_{6} \) sample (with unknown ASD) studied in [Ref. [32]] were attributed to the sharp
TABLE II. Magnetic parameters (Curie and Weiss constants, effective paramagnetic moment) obtained from the fit to a Curie-Weiss law for the three \( Y_{2}CoMnO_{6} \) samples studied. The different cooling conditions in the sample preparation and the number of ASDs are also indicated in the table.
| Specimen | Cooling conditions | ASD (%) | C(emu K mol \( ^{-1} \) ) | \( \theta \) (K) | \( \rho_{\text{eff}}(\mu_{\text{B}}/\text{f.u.}^{-1}) \) |
| S sample | 0.1 \( ^{\circ} \) min \( ^{-1} \) | 8.2 | 4.90 | 81.2 | 6.26 |
| M sample | 5 \( ^{\circ} \) min \( ^{-1} \) | 21.1 | 5.10 | 71.8 | 6.39 |
| Q sample | Quench | 46.3 | 4.90 | 49.0 | 6.26 |
transformation of E-type regions into FM ones (martensiticlike transformation). However, our neutron diffraction study precludes this scenario. First, we do not detect E-type ordering, and second, in our reference single-phase sample, there are no phase-separated regions with distinct magnetic orderings (AFM versus FM regions). Indeed, the steps resemble the behavior of magnetic avalanches in related systems \( [33–35] \) , and the abrupt reversal of the magnetic moment of entire domains at critical fields should not be ignored in the present case. Notice that the data at high fields (see inset of Fig. 8) reveal that \( M(H) \) is nonlinear, and the loop does not close up to the maximum field applied. The magnetic moment at this field is significantly below the value expected for a fully saturated Co/Mn sublattice \( (6\mu_{\mathrm{B}}\;\mathrm{f.u.}^{-1}) \) in contradiction with the refined magnetic moments in the neutron patterns, very close to the theoretical value. It is well known that ASDs may prevent full magnetic saturation in a hysteresis loop due to the appearance of competitive AFM interactions \( [36] \) . However, the refined ASD obtained from neutron diffraction cannot account for the experimental difference in the present case. Antisite defects may occur singly as point defects, or they may be grouped resulting in antiphase boundaries (APBs) as planar defects. Antiphase boundaries were observed in related double perovskites, and the interaction between atoms at the APB-domain borders lead to strongly pinned magnetic domain walls \( [37] \) . In particular, ordered and disordered domains were studied in \( La_{2}CoMnO_{6} \) films, revealing the presence of the same cations \( (\mathrm{Co}^{2+} \) and \( Mn^{4+}) \) in both types of domains \( [38] \) . The mechanism in \( Y_{2}CoMnO_{6} \) samples would then be as follows: APBs are formed by the same number of regions rich in either \( Co^{2+} \) or \( Mn^{4+} \) . In both cases, strong AFM Co-O-Co or Mn-O-Mn interactions across the APB would orient neighboring Co/Mn ordered FM domains in antiparallel directions. This would lead to a sharp decrease of the magnetic saturation of the hysteresis loop, and strong magnetic fields would be necessary to break the pinning force at the APB to align neighboring FM domains in the field direction and to produce the avalanchelike effect. The different natures of APBs (Co- or Mn-rich) and the different sizes may account for the occurrence of several steps in the magnetic loops and the lack of magnetic saturation at relatively high magnetic fields.
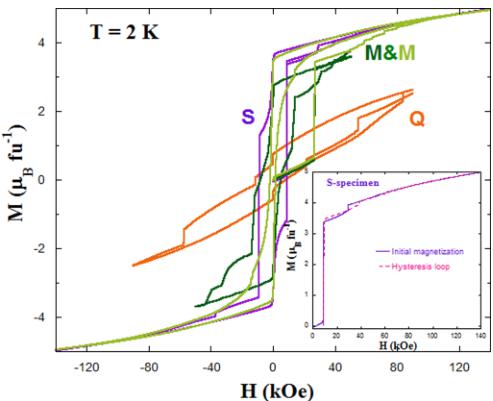
Figure 9 compares the loops obtained for the three different samples at 2 K. In the specimen S (with the highest Mn/Co cationic order), the initial magnetization curve shows the first strong jump at 8750 Oe (see inset of Fig. 9) and a second much smaller one at 28 750 Oe. The envelope of the complete loop at 140 kOe shows the same first jump, but the second one is shifted to \( \sim39\,700 \) Oe, i.e., 10 kOe above the virgin curve. This discrepancy between both curves might indicate that the nucleation of reverse domains also affects the pinning force of APBs. More significant is the hysteresis behavior of the M specimen. We show two loops for this sample in Fig. 9, one loop where the highest field achieved was 50 kOe, while the second loop was measured up to a maximum field of 140 kOe. The first step is observed at 26 140 Oe in the initial magnetization of this sample. This curve lies well outside of the closed loop, whose steps are more smoothed. In fact, the smoothing increases with increasing the maximum magnetic field in the loop. Magnetization at 50 kOe is smaller for the M sample than for the S one. As a first approximation, this

FIG. 9. Magnetic hysteresis loops for the three \( Y_{2}CoMnO_{6} \) samples as indicated in the plot. Inset: Detail of the loop for S specimen to compare the virgin curve to the envelope loop.
difference could be explained by the different ASDs. However, more intense magnetic fields lead to successive small jumps increasing the magnetization value, which at 140 kOe reaches a similar magnitude to that shown by the sample S. This result suggests a large number of smaller domains to be oriented in the field directions for the M specimen. Regarding the sample Q with the greater Co/Mn disorder, the loop is very wide with several small jumps. The magnetization at high fields is considerably smaller, in agreement with the difficulty in reaching magnetic saturation in a disordered system with competitive interactions.
D. Dielectric properties
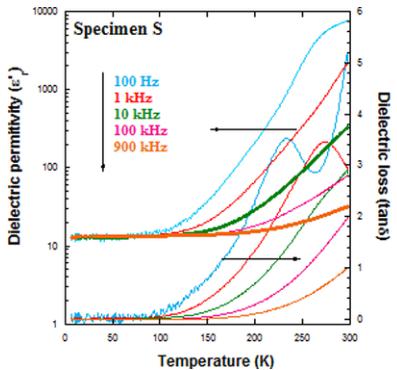
Previous studies have reported that \( La_{2}CoMnO_{6} \) has a large real part of the complex dielectric permittivity \( (\varepsilon_{r}^{\prime}) \) at high temperature [39]. Huge values of \( \varepsilon_{r}^{\prime} \) were also found in the \( La_{2-x}Tb_{x}CoMnO_{6} \) series at room temperature [16]. Figure 10 shows \( \varepsilon_{r}^{\prime} \) and the dielectric loss factor (tan \( \delta \) ) for \( Y_{2}CoMnO_{6} \) (S sample) extracted from the analysis of the impedance data at selected frequencies. These plots illustrate the ac dielectric dispersion for different frequencies. Here, \( \varepsilon_{r}^{\prime}(T) \) curves exhibit a steplike increase from a low-temperature value of \( \sim \) 13, quite typical for perovskite compounds, to huge values of \( \sim \) 10 \( ^{3} \) at room temperature and at low frequencies. This step shifts to higher temperatures with increasing frequency and is accompanied by a peak in the tan \( \delta \) . Beyond this peak, tan \( \delta \) rises, indicating a strong electronic contribution at room temperature. Similar features in other oxides are due to extrinsic effects such as Maxwell-Wagner type contributions of depletion layers at the interface between the sample and the electrodes or at grain boundaries [40–42]. The main difference between La- and Y-based samples refers to the temperature for the steplike increase that is higher for the latter compound. This might be related to the more insulating character of \( Y_{2}CoMnO_{6} \) . It is noteworthy that no anomaly was detected in the \( \varepsilon_{r}^{\prime}(T) \) curves at low temperatures including the magnetic


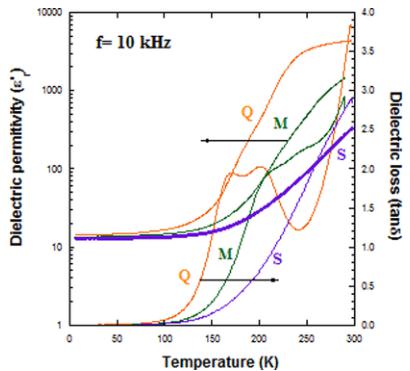
FIG. 10. Left: Temperature dependence of the dielectric constant ( \( \varepsilon_{r}^{\prime} \) ) and the dielectric loss (tan \( \delta \) ) at five selected frequencies for \( Y_{2}CoMnO_{6} \) (S specimen). Right: Comparison of \( \varepsilon_{r}^{\prime} \) and \( \tan\delta \) curves measured at 10 kHz for the three \( Y_{2}CoMnO_{6} \) samples.
transition temperature, which is at odds with the reported multiferroic properties of \( Y_{2}CoMnO_{6} \) [10]. Regarding the effect of Mn/Co ordering, we have observed that electrical resistance increases with decreasing the number of ASDs as inferred from the temperature dependence of the real part of impedance (see the Supplemental Material [22]). Figure 10 also compares \( \varepsilon_{r}^{\prime} \) and \( \tan\delta \) currents of the three studied specimens. The steplike anomaly in the dielectric constant is shifted to lower temperatures as the Mn/Co disorder increases. Moreover, it is broadened, and two inflection points are becoming visible. Accordingly, two peaks are observed in the \( \tan\delta \) curves, which are best revealed for the Q sample. These results suggest that an increase in the ASDs of the sample is accompanied by an increase in number of structural defects or impurity states favoring the electron conduction by electron hopping.
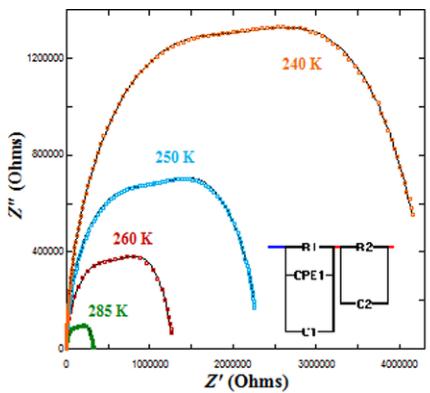
Here, ac impedance spectroscopy measurements for the ordered S sample were made over a wide range of frequencies \( (10 - 10^{7} \text{ Hz}) \) at selected temperatures between 220 and 310 K. Figure 11 shows some examples of the Cole-Cole (Z versus Z') plots obtained. At high temperature, the Cole-Cole plots are composed by two overlapped semicircles that are ascribed to different contributions from the specimen. The first semicircle beginning at the origin of the plot is associated with the bulk properties of the sample, while the second semicircle at higher values of Z' component is connected with extrinsic features of the ceramic compound such as grain boundaries and electrode layers. As the temperature decreases, the sample becomes more resistive, and the first semicircle grows up and is shifted to higher frequencies. Below 220 K, less than half a semicircle is measured preventing an accurate analysis.
The data were quantitatively analyzed by the equivalent-circuit model generally used in impedance spectroscopy analysis with the AIS spectrum analyzer program [43]. The intrinsic contribution from the \( Y_{2}CoMnO_{6} \) is modeled with


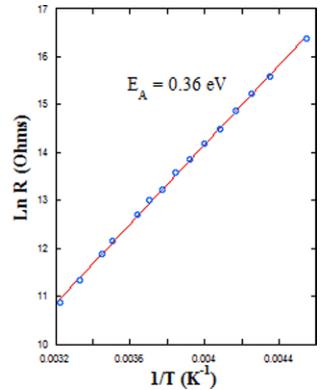
FIG. 11. Left: The complex impedance plots for \( Y_{2}CoMnO_{6} \) (S specimen) at the indicated temperatures. The model used to analyze the data is also included. Right: Temperature dependence of the bulk resistance obtained from impedance analysis. The straight line represents the fit to an Arrhenius law.


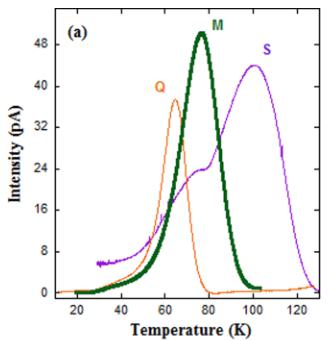
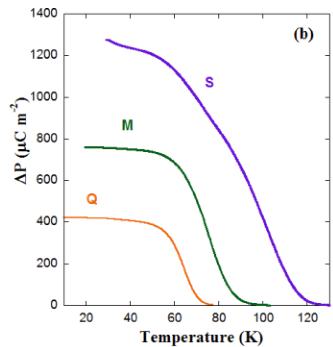
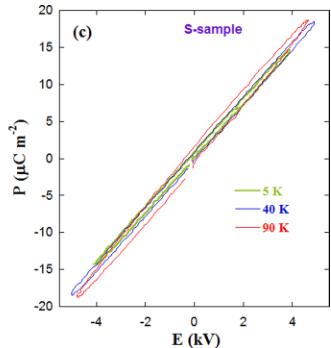
FIG. 12. (a) Temperature dependences of pyroelectric currents for the three \( Y_{2}CoMnO_{6} \) specimens obtained with a poling field of \( 4\,kV\,cm^{-1} \) and a heating rate of \( 2\,K\,min^{-1} \) . (b) Temperature dependence of polarization for the same samples obtained by integrating the previous pyroelectric currents. (c) \( P(E) \) curves measured on the S sample at the temperatures indicated for a frequency of 250 Hz.
three elements in parallel (see inset in Fig. 10): a bulk dc resistance (R1), the high frequency limit of the bulk capacitance (C1), and a constant phase element (CPE1) to account for the hopping conductivity contribution of the localized charge carriers (ac conductivity) [43]. The second semicircle is modeled with another RC element, representing the extrinsic resistance (R2) and capacitance (C2), connected in series with the bulk element. The bulk resistance extracted from this analysis follows an activated behavior, as can also be seen in Fig. 11. The data have been fitted to an Arrhenius law yielding activation energy of 0.36 eV, in agreement with the values obtained for related compounds by the four-probe configuration [16]. Here, C1 has values about 70 pF at room temperature and almost independent of the temperature down to 200 K. The capacitance values are in agreement with the ones observed in polycrystalline ceramics with grain boundaries contributions [42].
E. Pyroelectric properties
One of the most striking recent results for \( Y_{2}CoMnO_{6} \) is the claim of a ferroelectric transition coupled to the magnetic transition [10]. This statement was concluded from measurements of the pyroelectric current. The polarization onset coincided with the magnetic transition, and it was considered as proof of a magnetically driven ferroelectric transition due to the E-type magnetic ground state (deduced from an apparent AFM reflection detected at 2.7 K in the FM sample). Our neutron diffraction study has demonstrated a collinear FM structure for this compound (with tiny A-type reflections hardly perceptible), at odds with the previous interpretation. In order to shed light on this subject, pyroelectric current measurements were carried out to determine the exact nature of the reported ferroelectric behavior. Figure 12(a) shows the pyroelectric current of the three \( Y_{2}CoMnO_{6} \) specimens as a function of temperature. In all cases, we used a poling field of \( 5kV cm^{-1} \) and the same heating rate of \( 2K min^{-1} \) . The three samples exhibit broad current peaks which are reversed when applying reversed poling fields (see the Supplemental Material [22]). The curves for samples Q and M have a single peak at 64 and 76 K, respectively. However, the S specimen shows two peaks at 76 and 100 K. Accordingly, the polarization (P) curves obtained by integrating the pyroelectric current display a ferroelectriclike transition whose onset strongly depends on the specimen, and then on the number of ASDs, as can be seen in Fig. 12(b). Comparing the three samples, we observe an increase of 36 K in the position of the current peak between the Q and S samples. However, as shown above, the shift of \( T_{C} \) for these samples is only about 5 K. This indicates that the abovementioned coincidence between magnetic and electric transitions for a particular sample seems casual. On the other hand, the magnitude of P increases as ASDs decrease, suggesting that Co/Mn cationic ordering favors the dipole formation.
However, the lack of anomaly in the \( \varepsilon_{r}^{\prime}(T) \) curves (see Fig. 10) strongly indicates that the emergence of pyroelectric current is not related to a ferroelectric phase transition. In order to confirm this, electric field dependent polarization measurements \( P(E) \) were performed at different temperatures, as can be seen in Fig. 12(c). The linear dependence of the \( P(E) \) curve is typical of a dielectric, and no spontaneous polarization is detected. Moreover, current peaks at ferroelectric transitions are sharp, while very broad peaks are commonly due to either depolarization of trapped charges or defect dipoles reorientation [44,45]. Both effects give rise to thermally stimulated depolarization current (TSDC) peaks. Recently, TSDC peaks have been characterized in a large number of systems including some multiferroic perovskites [44–50].
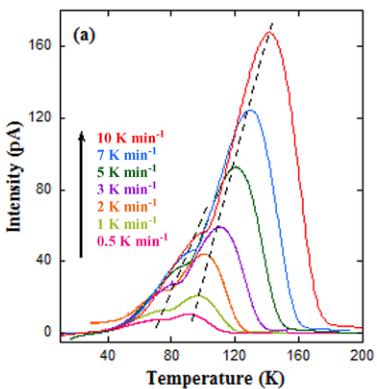
With the aim of uncovering the origin of the pyroelectric current peaks in our samples, we studied their dependences on heating rate, poling voltage, and magnetic field focusing in the S specimen. The temperature dependence of pyroelectric currents for different heating rates in this sample is displayed in Fig. 13(a). The temperature position of both peaks increases considerably with heating rate in agreement with TSDC behavior [44,45,47,49]. The temperature position of TSDC peaks is related to the heating rate by the formula in Eq. (1) for both dipole reorientation and release of trapped charges [44,51]
\[ \frac{U}{k_{\mathrm{B}}}=\frac{1}{\beta\tau^{0}}e^{(\frac{-U}{k_{\mathrm{B}}T_{\max}})}T_{\max}^{2}, \quad (1) \]


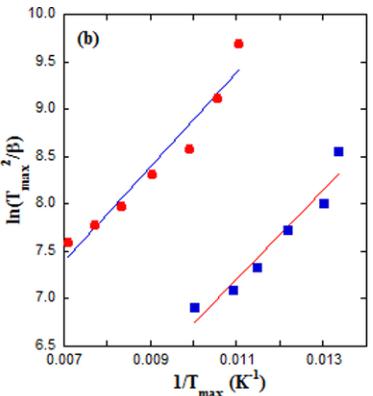
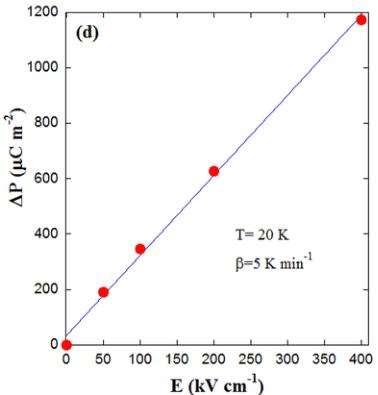
FIG. 13. (a) Temperature dependence of the pyroelectric current of the \( Y_{2}CoMnO_{6} \) (S specimen) obtained with a poling field of \( 4\,kV\,cm^{-1} \) for the indicated heating rates. Broken lines are guides for the eyes. (b) Variation of peak temperature versus heating rate plotted as \( T^{2}_{max}/\beta \) versus \( 1/T_{max} \) for the same compound. The lines are fits to Eq. (1). (c) Time dependence of the pyroelectric current for the same sample obtained with a heating rate of \( 5\,K\,min^{-1} \) for the indicated poling fields. (d) Polarization versus poling field curve for this specimen obtained from the previous pyroelectric currents. The line shows a linear fit.
where \( U, k_{B}, \beta, \tau^{0} \) , and \( T_{max} \) stand for activation energy, Boltzmann constant, heating rate, relaxation time, and position of the TSDC peak maximum, respectively. Figure 13(b) shows that data from both peaks can be fitted to the formula in Eq. (1), yielding activation energies close to 0.05 eV in both cases.
We also measured the obtained polarization for various poling fields with a heating rate of \( 5 \, K min^{-1} \) , as can be seen in Fig. 13(c). From these results, we can extract the P versus electric field (E) curves at different temperatures. Figure 13(d) shows a linear relationship at low electric fields. Such a linear dependence is ascribed to relaxation of defect dipoles, whereas the release of trapped charges follows an exponential relationship [44]. Therefore, the pyroelectric currents in \( Y_{2}CoMnO_{6} \) should be ascribed to TSDC that are likely due to defect dipole reorientation. A plausible mechanism could be similar to that reported [48] for Fe-doped \( SrTiO_{3} \) , where it has been suggested that the defect dipole pair consists of a \( Fe^{3+} \) substituting the \( Ti^{4+} \) site and the compensating oxygen vacancies. In a similar way, ASDs occur naturally in \( Y_{2}CoMnO_{6} \) yielding APBs, and it is precisely at the APB where it is more likely to develop compensating vacancies. In this case, it may be counterintuitive that the sample with fewer ASDs presents the highest P magnitude at the highest temperature, but one must take into account that Co/Mn cationic disorder also affects the coherent formation of APBs and the homogeneous distribution of them. In this way, uniform distribution of APBs in the S specimen is consistent with the sharp transitions in the magnetic hysteresis loops due to the flip of entire magnetic domains. Regarding chemical composition of APBs, the right stoichiometry imposes the same ratio of Co-rich and Mn-rich APBs in the sample. Different compensating vacancies are expected for them. In the first case, \( Co^{2+} \) is occupying the \( Mn^{4+} \) site, so oxygen vacancies are expected. In the second one, \( Mn^{4+} \) substitutes the \( Co^{2+} \) site, so cationic vacancies are more likely. This might be the explanation for the emergence of two peaks in the
pyroelectric current of the S specimen corresponding to two different kinds of dipoles with different relaxation times. In disordered compounds, the lack of homogeneous APBs leads to a single peak due to defect dipoles randomly distributed in the sample. This explanation also accounts for the lack of ferroelectric behavior in the \( P(E) \) loops as the relaxation times observed in the pyroelectric currents are of several minutes, far above the characteristic time in \( P(E) \) measurements.
Finally, we have measured the obtained polarization, keeping fixed the poling field and heating rate and changing the external magnetic field between 0 and 10 T (see the Supplemental Material [22]). No significant differences were observed in the pyroelectric current, indicating the lack of significant magnetoelectric coupling in these samples. This agrees with the absence of relationship between magnetic transition and the existence of pyroelectric current.
IV. CONCLUSIONS
We have performed an investigation of the magnetoelectric properties of \( Y_{2}CoMnO_{6} \) and related them to the structural ones. This compound adopts the monoclinic structure of double perovskites, and we have confirmed that the Co/Mn cationic ordering is strongly dependent on synthesis details, in particular on the cooling rate. The slower the cooling rate, the lower the number of ASDs as indicated by neutron diffraction refinements. We have established the magnetic structure composed of a collinear FM arrangement of \( Co^{2+} \) and \( Mn^{4+} \) moments in the xz plane with a minor AFM canting along the y direction. This paper rejects the formation of an E-type magnetic structure reported in previous papers [10,11].
Ferromagnetic order is visible from macroscopic measurements. Structural disorder affects the magnetic transition temperature very little, but greatly changes the hysteresis loops at very low temperature. Ordered samples exhibit sharp steps in the \( M(H) \) curves due to sudden reorientation of pinned domains. These domains are separated by APBs forcing an antiparallel alignment at zero field. Disorder not only decreases the size of magnetically ordered domains, but also the homogeneity of APBs yielding hysteresis cycles with a greater number of smaller jumps.
Y₂CoMnO₆ is insulating, and the electrical resistance decreases as the number of ASDs increases. Real dielectric permittivity reveals a typical value for perovskite compounds at 5 K. At low temperatures, \( \varepsilon_{r}^{\prime} \) is frequency independent without any noticeable anomaly. Above 120–150 K, \( \varepsilon_{r}^{\prime} \) exhibits step increases coupled to peaks in the tanδ, indicating a thermally activated relaxed process in the conductivity of Y₂CoMnO₆. The onset of this process moves to lower temperatures for disordered samples. At room temperature, the huge values of the dielectric constant should be ascribed to Maxwell-Wagner depletion layers. In fact, the analysis of the Nyquist plots shows that the intrinsic permittivity above 220 K is similar to the expected values for nonferroelectric ceramic compounds.
As a recent relevant issue, we discussed the pyroelectric and polarization properties of \( Y_{2}CoMnO_{6} \) . Broad peaks in the pyroelectric current were observed at temperatures \( \pm20 \) K about the magnetic transition depending on the number of ASDs. Moreover, a lack of spontaneous polarization is noticeable in the \( P(E) \) loops. A systematic study on heating rate and on poling field variations reveals the nature of these peaks as TSDC. We find that the occurrence of this current does not originate from a ferroelectric phase transition but from the reorientation of defect dipoles. When the poling field is applied at high temperature, these dipoles are oriented, and they remain oriented on cooling even after removal of the external field because the relaxation time is infinitely long at low temperature. On heating, relaxation is activated, and the accumulated charge is released. We have proposed that these dipoles are mainly placed at the APBs and arise from the sites exchanged by \( Co^{2+} \) and \( Mn^{4+} \) cations. The lack of a ferroelectric transition is also supported by the absence of any related anomaly in the dielectric permittivity of the studied samples. Accordingly, no significant magnetodielectric effect was found for these compounds.
In summary, this paper points to the need for a complete characterization by complementary methods to clearly discern a true multiferroic compound. Therefore, it should help to understand the recent emergence of a large number of unexpected new compounds exhibiting ferroelectriclike transitions.
ACKNOWLEDGMENTS
For financial support we thank the Spanish Ministerio de Economía y Competitividad (MINECO) (Projects No. MAT2012-38213-C02-01 and -02 and No. MAT2015-68760-C1-1 and -2-P, cofunded by the European Regional Development Fund [ERDF] from the European Union) and Diputación General de Aragón (DGA, project E-69). We also acknowledge ILL and CELLS-ALBA for beamtime allocation and staff collaboration, and the use of Servicio General de Apoyo a la Investigación-SAI from Universidad de Zaragoza. J.A. Rodríguez-Velamazán acknowledges CSIC for the JAEdoc contract.
[1] J. F. Scott, Nat. Mater. 6, 256 (2007).
[2] A. P. Pyatakov and A. K. Zvezdin, Phys.-Usp. 55, 557 (2012).
[3] S. Kumar, G. Giovannetti, J. van den Brink, and S. Picozzi, Phys. Rev. B 82, 134429 (2010).
[4] I. A. Sergienko, C. Sen, and E. Dagotto, Phys. Rev. Lett. 97, 227204 (2006).
[5] S. Picozzi and C. Ederer, J. Phys.:Condens. Matter 21, 303201 (2009).
[6] S. Picozzi, Kunihiko Yamauchi, I. A. Sergienko, C. Sen, B. Sanyal, and E. Dagotto, J. Phys.:Condens. Matter 20, 434208 (2008).
[7] S. Yáñez-Vilar, E. D. Mun, V. S. Zapf, B. G. Ueland, J. S. Gardner, J. D. Thompson, J. Singleton, M. Sánchez-Andújar,
J. Mira, N. Biskup, M. A. Señarís-Rodríguez, and C. D. Batista, Phys. Rev. B 84, 134427 (2011).
[8] J. Blasco, J. L. García-Muñoz, J. García, J. Stankiewicz, G. Subías, C. Ritter, and J. A. Rodríguez-Velamazán, Appl. Phys. Lett. 107, 012902 (2015).
[9] N. Lee, H. Y. Choi, Y. J. Jo, M. S. Seo, S. Y. Park, and Y. J. Choi, Appl. Phys. Lett. 104, 112907 (2014).
[10] G. Sharma, J. Saha, S. D. Kaushik, V. Siruguri, and S. Patnaik, Appl. Phys. Lett. 103, 012903 (2013).
[11] C. Y. Ma, S. Dong, P. X. Zhou, Z. Z. Du, M. F. Liu, H. M. Liu, Z. B. Yan, and J.-M. Liu, Phys. Chem. Chem. Phys. 17, 20961 (2015).
[12] I. O. Troyanchuk, D. D. Khalyavin, J. W. Lynn and R. W. Erwin, Q. Huang, H. Szymczak, R. Szymczak, and M. Baran, J. Appl. Phys. 88, 360 (2000).
[13] M. Mouallem-Bahout, T. Roisnel, F. Bourée, G. André, C. Moure, and O. Peña, Prog. Sol. State Chem. 35, 257 (2007).
[14] H. S. Nair, R. Pradheesh, Y. Xiao, D. Cherian, S. Elizabeth, T. Hansen, T. Chatterji, and Th. Brückel, J. Appl. Phys. 116, 123907 (2014).
[15] A. J. Barón-González, C. Frontera, J. L. García-Muñoz, B. Rivas-Murias, and J. Blasco, J. Phys.: Condens. Matter 23, 496003 (2011).
[16] J. Blasco, J. García, G. Subías, J. Stankiewicz, S. Lafuerza, J. A. Rodríguez-Velamazán, C. Ritter, and J. L. García-Muñoz, J. Phys.: Condens. Matter 26, 386001 (2014).
[17] S-W. Cheong and M. Mostovoy, Nat. Mater. 6, 21 (2007).
[18] R. D. Shannon, Acta Cryst. A32, 751 (1976).
[19] J. Blasco, G. Subías, J. García, J. L. García-Muñoz, C. Ritter, and J. A. Rodríguez-Velamazán, VI European Conference on Neutron Scattering (Zaragoza, Spain, 2015).
[20] R. I. Dass and J. B. Goodenough, Phys. Rev. B 67, 014401 (2003).
[21] T. Kyömen, R. Yamazaki, and M. Itoh, Chem. Mat. 15, 4798 (2004).
[22] See Supplemental Material at http://link.aps.org/supplemental/10.1103/PhysRevB.93.214401 for chemical composition of the three samples; x-ray pattern at 300 K; magnetization curves for the three specimens; comparison of the real part of impedance and plots of the dielectric constant; reversal of the pyroelectric effect and the influence of a magnetic field on the electric polarization.
[23] F. Fauth, I. Peral, C. Popescu, and M. Knapp, Powder Diffraction 28, S360 (2013).
[24] J. Rodriguez-Carvajal, Physica. B 192, 55 (1993).
[25] J. Blasco, M. C. Sánchez, J. Pérez-Cacho, J. García, G. Subías, and J. Campo, J. Phys. Chem. Solids 63, 781 (2002).
[26] V. F. Sears, Neutron News 3, 26 (1992); or see NIST database at www.ncnr.nist.gov/resources/n-lengths/
[27] V. Cuartero, J. Blasco, J. García, S. Lafuerza, G. Subías, J. A. Rodríguez-Velamazán, and C. Ritter, J. Phys.: Condens. Matter 24, 455601 (2012).
[28] E. F. Bertaut, Acta Crystallogr. Sect. A 24, 217 (1968).
[29] L. M. García, J. Bartolomé, F. J. Lázaro, C. de Francisco, and J. M. Muñoz, Phys. Rev. B 54, 15238 (1996).
[30] J. Blasco, J. García, M. C. Sánchez, J. Campo, G. Subías, and J. Pérez-Cacho, Eur. Phys. J. B 30, 469 (2002).
[31] J. M. D. Coey, Magnetism and Magnetic Materials (Cambridge University Press, Cambridge, 2010), pp. 115.
[32] J. K. Murthy, K. D. Chandrasekhar, H. C. Wu, H. D. Yang, J. Y. Lin, and A. Venimadhav, Europhys. Lett. 108, 27013 (2014).
[33] D. S. Rana and S. K. Malik, Phys. Rev. B 74, 052407 (2006).
[34] L. D. Tung, Phys. Rev. B 72, 054414 (2005).
[35] C. Yaicle, C. Frontera, J. L. García-Muñoz, C. Martin, A. Maignan, G. André, F. Bourée, C. Ritter, and I. Margiolaki, Phys Rev. B 74, 144406 (2006).
[36] J. M. Michalik, J. M. De Teresa, C. Ritter, J. Blasco, D. Serrate, M. R. Ibarra, C. Kapusta, J. Freudenberger, and N. Kozlova, Europhys. Lett. 78, 17006 (2007).
[37] T. Asaka, X. Z. Yu, Y. Tomioka, Y. Kaneko, T. Nagai, K. Kimoto, K. Ishizuka, Y. Tokura, and Y. Matsui, Phys. Rev. B 75, 184440 (2007).
[38] R. Egoavil, S. Hühn, M. Jungbauer, N. Gauquelin, A. Béché, G. Van Tendeloo, J. Verbeeck, and V. Moshnyaga, Nanoscale 7, 9835 (2015).
[39] M. P. Singh, K. D. Truong, and P. Fournier, Appl. Phys. Lett. 91, 042504 (2007).
[40] P. Lunkenheimer, V. Bobnar, A. V. Pronin, A. I. Ritus, A. A. Volkov, and A. Loidl, Phys. Rev. B 66, 052105 (2002).
[41] P. Lunkenheimer, R. Fichtl, S. G. Ebbinghaus, and A. Loidl, Phys. Rev. B 70, 172102 (2004).
[42] S. Lafuerza, J. García, G. Subías, J. Blasco, K. Conder, and E. Pomjakushina, Phys. Rev. B 88, 085130 (2013).
[43] A. S. Bondarenko and G. A. Ragoisha in Progress in Chemometrics Research, edited by A. L. Pomerantsev (Nova Science Publishers, New York, 2005), pp. 89–102 (the program is available online at http://www.abc.chemistry.bsu.by/vi/analyser/).
[44] X. Zhang, Y. G. Zhao, Y. F. Ci, L. D. Ye, D. Y. Zhao, P. S. Li, J. W. Wang, M. H. Zhu, H. Y. Zhang, and G. H. Rao, Appl. Phys. Lett. 104, 062903 (2014).
[45] N. Horiuchi, Y. Tsuchiya, K. Nozaki, M. Nakamura, A. Nagai, and K. Yamashita, Sol. State Ion. 262, 500 (2014).
[46] Y. Kohara, Y. Yamasaki, Y. Onose, and Y. Tokura, Phys. Rev. B 82, 104419 (2010).
[47] T. Zou, Z. Dun, H. Cao, M. Zhu, D. Coulter, H. Zhou, and X. Ke, Appl. Phys. Lett. 105, 052906 (2014).
[48] T. N. M. Ngo, U. Adem, and T. T. M. Palstra, Appl. Phys. Lett. 106, 152904 (2015).
[49] N. Horiuchi, M. Nakamura, A. Nagai, K. Katayama, and Y. Yamashita, J. Appl. Phys. 112, 074901 (2012).
[50] W. Liu and C. A. Randall, J. Am. Ceram. Soc. 91, 3245 (2008).
[51] C. Bucci, R. Fieschi, and G. Guidi, Phys. Rev. 148, 816 (1966).
 p10_0.jpg
 p10_1.jpg
 p10_2.jpg
 p10_3.jpg
 p3_0.jpg
 p4_0.jpg
 p4_1.jpg
 p5_0.jpg
 p5_1.jpg
 p5_2.jpg
 p6_0.jpg
 p6_1.jpg
 p7_0.jpg
 p8_0.jpg
 p8_1.jpg
 p8_2.jpg
 p8_3.jpg
 p9_0.jpg
 p9_1.jpg
 p9_2.jpg