| Transition Temperature | 39 K |
|---|---|
| Experiment Temperature | 15 K |
| Propagation Vector | k1 (0, 0, 0) |
| Parent Space Group | P42/mnm (#136) |
| Magnetic Space Group | P42'/mnm' (#136.499) |
| Magnetic Point Group | 4'/mm'm (15.4.56) |
| Lattice Parameters | 4.69410 4.69410 3.16980 90.00 90.00 90.00 |
|---|---|
| DOI | 10.1107/s0108767303022803 |
| Reference | W. Jauch, M. Reehuis and A.J. Schultz, Acta Crystallographica Section A Foundations of Crystallography (2003) 60 51-57. |
| Label | Element | Mx | My | Mz | |M| |
|---|---|---|---|---|---|
| Co1 | Co | 0.0 | 0.0 | 2.60 | 2.60 |
γ-ray and neutron diffraction studies of CoF₂: magnetostriction, electron density and magnetic moments
Acta Crystallographica Section A Foundations of Crystallography
ISSN 0108-7673
Received 27 August 0803 Accepted 10 October 2003
W. Jauch, \( ^{a*} \) M. Reehuis \( ^{b} \) and A. J. Schultz \( ^{c} \)
\( ^{a} \) Hahn-Meitner-Institut, Glienicker Strasse 100, D-14109 Berlin, Germany, \( ^{b} \) Institut für Physik, EKM, Universität Augsburg, Universitätsstrasse 1, D-86159 Augsburg, Germany, and \( ^{c} \) Intense Pulsed Neutron Source, Argonne National Laboratory, Argonne, IL 60439, USA. Correspondence e-mail: jauch@hmi.de
Accurate structure factors up to \( \sin\theta/\lambda = 1.6 \, \AA^{-1} \) have been measured with 316.5 keV \( \gamma \) -rays from \( CoF_{2} \) , both at room temperature and in the antiferromagnetic state at 10 K. The same crystal was used to collect extended time-of-flight neutron diffraction data in the two magnetic states, which allowed an accurate determination of the fluorine positional parameter. For room temperature, the standard structural parameters are reported. At 10 K, a complete charge-density study has been carried out. The total number of 3d electrons on Co is found to be 6.95 (3). The experimental populations of the d orbitals agree with expectation from crystal field theory. The fluorine valence region exhibits a strong dipolar deformation. Electronic properties at the bond critical points and integrated atomic properties are derived from the static model electron density, revealing the Co—F interactions as purely ionic. On magnetic ordering, a shift of the fluorine ions of \( 1.5 \, (4) \times 10^{-3} \, \AA \) is found which confirms a prediction from theory of optical birefringence. The effect of magnetostriction on the distortion of the ligand coordination octahedra is compared for the late members of the 3d transition-metal difluorides. From neutron powder diffraction, an ordered magnetic moment of \( 2.60 \, (4) \, \mu_{B} \) per cobalt ion is found. Despite the strong deviation from the ideal spin value of \( 3 \, \mu_{B} \) , there is still an appreciable orbital contribution to the local magnetic moment.
1. Introduction
In recent years, the prototypic antiferromagnets \( MnF_{2} \) , \( FeF_{2} \) , and \( NiF_{2} \) have been studied extensively by the combined use of \( \gamma \) -ray and neutron diffraction (e.g. Palmer & Jauch, 1993; Jauch et al., 1999). Our interest was prompted by the predicted implications of small magnetostrictive shifts of the anions on the optical properties, and later focused on the exploration of the electron-density distribution related to magnetic ordering. An important result emerging from the two complementary techniques was the evidence for a sharp polarization of the fluorine core-electron shell in antiferromagnetic \( MnF_{2} \) . In the present work, the combined diffraction studies of the transition-metal difluorides are completed with \( CoF_{2} \) .
With the use of \( \gamma \) radiation, the high-energy diffraction case (photon energy \( \gg \) binding energy of K-shell electrons) is fully realized for all elements except the very heaviest ones so that fewer corrections and assumptions have to be made in the process of deriving structure factors from the observed integrated intensities. It is important to note that the improvement in accuracy is not solely a consequence of the high photon energy but is also brought about by additional favourable experimental conditions. The incident \( \gamma \) beam is perfectly stable in both space and time. The absence of any optical device ensures a uniform and simple instrumental resolution. The sample is illuminated in a wide uniform beam. The bulk is probed and no surface treatment is necessary. The nuclear \( \gamma \) lines have a very narrow spectral spread of \( \Delta\lambda/\lambda = 10^{-6} \) so that multiple diffraction is suppressed. The incident-beam conditions are rather different from those met with in high-energy synchrotron X-ray studies where the use of small crystals may cause severe problems in the treatment of extinction because the volume of the imperfect surface region is of the same order as that of the more perfect bulk. The small monochromator Bragg angles for high energies give relatively large values of \( \Delta\lambda/\lambda \) , and quite disturbing multiple diffraction effects may occur.
The \( \gamma \) -ray investigation is complemented by time-of-flight pulsed neutron diffraction on the same crystal in order to yield a precise definition of the structural geometry of \( CoF_{2} \) . Finally, powder neutron diffraction data were collected to arrive at an accurate value of the ordered magnetic moment on cobalt,
which rather surprisingly is missing in the literature. The present study aimed at the determination of a reliable electron-density model combined with an analysis of associated local and atomic topological properties. The results are compared with those reported in a recent synchrotron X-ray study of \( CoF_{2} \) carried out at room temperature (O'Toole & Streltsov, 2001).
2. The \( CoF_{2} \) crystal
\( CoF_{2} \) has a rutile-type structure (space group \( P4_{2}/mnm \) ) with Co at 000, \( \frac{1}{2}\frac{1}{2}\frac{1}{2} \) , and F at \( \pm(xx0, \frac{1}{2}-x, \frac{1}{2}+x, \frac{1}{2}) \) . The lattice constants are \( a = 4.6950, c = 3.1785 \) Å at 295 K, and \( a = 4.6941, c = 3.1698 \) Å at 10 K with standard deviations of less than \( 5 \times 10^{-5} \) Å as reported by Haefner (1964). Below 37.7 K, antiferromagnetic ordering occurs with the spins aligned along the tetragonal c axis.
The single-crystal sample used in these experiments was a rectangular prism of approximate dimensions \( 1.91 \times 2.3 \times 2.5 \, mm \) ; the latter two values are approximate owing to a somewhat irregular shape. Double-crystal \( \gamma \) -ray diffraction with an angular resolution of \( 1.5^{\prime\prime} \) was used to measure diffraction profiles along three perpendicular directions. A very high degree of perfection was observed at room temperature (RT) where the full width at half-maximum (FWHM) was around \( 7^{\prime\prime} \) . At 10 K (LT), a considerable broadening occurred with its magnitude depending on the cooling run. In one case, a FWHM of around \( 18^{\prime\prime} \) was observed, in another run the FWHM varied between 30 and \( 40^{\prime\prime} \) . The \( \gamma \) -ray results quoted in this paper pertain to measurements under the latter conditions. The original value of the mosaic width was always reproduced after warming the sample back to RT.
3. Experimental and data analysis
3.1. \( \gamma \) -ray diffraction
Bragg intensities have been measured on the \( \gamma \) -ray diffractometer at the Hahn-Meitner-Institut. The most intense line of an \( {}^{192} \) Ir source with a wavelength of \( 0.0392\ \AA \) (316.5 keV) was used. The diffracted \( \gamma \) rays were registered in \( \omega \) step-scan mode with an intrinsic Ge planar detector. Data sets were collected at RT and 10 K.
The diffraction vectors extended up to \( \sin\theta/\lambda = 1.6\ \mathring{\mathrm{A}}^{-1} \) . The completeness in independent reflections was 60%. An absorption correction was carried out ( \( \mu = 0.476\ cm^{-1} \) ) resulting in a transmission range from 0.894 to 0.919. The data reductions were carried out using the Xtal (Hall et al., 1995) suite of crystallographic programs. The narrow scan widths imply that the results are not affected by TDS.
Structure refinements, based on \( |F|^{2} \) , were performed with the program system VALRAY (Stewart et al., 2000). The observations were weighted solely by their counting-statistical variances. In view of their different absorption-weighted path lengths, equivalent reflections were not averaged. Secondary extinction was treated according to Becker & Coppens (1975) by refining the width parameter of a Gaussian mosaic distribution.
3.2. Neutron diffraction
Neutron diffraction data were collected on the single-crystal diffractometer (SCD) at the Argonne pulsed spallation neutron source IPNS. The SCD instrument utilizes the Laue technique with time-of-flight (TOF) separation of the reflections in combination with a position-sensitive area detector. The same crystal was used throughout the \( \gamma \) -ray/neutron investigations. SCD data were collected at RT and at 15 K, where the temperature was controlled by monitoring the temperature dependence of the magnetic reflection 300. At both temperatures, 13 data histograms (x and y spatial coordinates on the detector and the time of flight t) were recorded, each of them with a counting time of 6 h. The Laue spots were integrated over a box of \( 5 \times 5 \times 5 \) elements. A wavelength range between 0.3 and 1.8 Å was selected, yielding data with \( \sin\theta/\lambda \) up to \( 2.65 \, \AA^{-1} \) (4345 observations). For the RT data, because significant intensities do not extend as far in reciprocal space as those at LT, only reflections above a wavelength of \( 0.5 \, \AA \) were considered as observed (981 observations). The absorption cross section was calculated from the total cross sections: \( \mu [cm^{-1}] = 0.39 + 0.59\lambda [\mathring{A}] \) . Local Argonne programs were used for data reduction and structure refinements. The RT data were corrected for thermal diffuse scattering according to Popa & Willis (1997) (for details see Jauch & Peters, 2001). Structure refinements against \( |F|^{2} \) were carried out with weights equal to \( w = [\sigma_{\text{count}}^{2} + (0.03|F|^{2})^{2}]^{-1} \) . From experience over the years, the instrumental precision in the determination of the net intensities has been found to be limited to about 3%. Neutron scattering lengths were taken from Sears (1995). Symmetry-equivalent reflections were not averaged since they appear at different wavelengths. The refinement included separate scale factors for each of the 13 histograms. A type I extinction-correction parameter was included as a variable parameter. At LT, mixed nuclear and magnetic reflections \( (h + k + l \text{ odd}) \) with \( \sin\theta/\lambda < 0.7 \, \mathring{A}^{-1} \) were excluded from the refinements, which were based solely on nuclear structure factors.
3.3. Magnetic neutron powder diffraction
Surprisingly, an experimental value for the ordered magnetic moment in \( CoF_{2} \) is lacking in the literature. We have therefore recorded a neutron powder diffraction pattern at \( T = 1.8 \, K \) on the two-axis diffractometer E9 at the BERII reactor (HMI Berlin) using a wavelength of \( 1.7971 \, \AA \) . The measurements were performed on a polycrystalline specimen purchased from Alfa Chemical Company. The scattering angle range covered \( 5-150^{\circ} \) . In the Rietveld refinement (18 pure or mixed magnetic reflections), the standard structural parameters were fixed to the values obtained from the single-crystal studies (see below). The best refinement gave \( R_{M} = 0.055 \, (\text{magnetic } R \text{ factor } R_{M} = \sum |I_{\text{obs}} - I_{\text{call}}| / \sum I_{\text{obs}}) \) . An ordered magnetic moment of \( 2.60 \, (4) \, \mu_{B} \) per Co ion is found which is considerably smaller than the ideal spin value of \( 3 \, \mu_{B} \) .
Table 1
RT result from high-order refinement with \( \sin\theta/\lambda\geq0.6\ \mathring{A}^{-1} \)
\( x_{neutron} \) denotes the positional parameter as derived from neutron diffraction. The extinction correction y relates the observed and kinematical intensities, \( I_{obs} = y I_{kin} \) . For comparison, the results from the synchrotron study of O'Toole & Streltsov (2001) are also presented.
| \( \gamma \) -rays | Synchrotron X-rays | ||
| Co | \( U_{11} \) ( \( \mathring{A}^{2} \) ) | 0.00695 (4) | 0.00685 (6) |
| \( U_{33} \) ( \( \mathring{A}^{2} \) ) | 0.00532 (4) | 0.00533 (7) | |
| \( U_{12} \) ( \( \mathring{A}^{2} \) ) | -0.00076 (9) | -0.00073 (5) | |
| F | \( U_{11} \) ( \( \mathring{A}^{2} \) | 0.01162 (10) | 0.01193 (16) |
| \( U_{33} \) ( \( \mathring{A}^{3} \) ) | 0.00790 (11) | 0.00803 (22) | |
| \( U_{12} \) ( \( \mathring{A}^{3} \) ) | -0.00480 (15) | -0.00529 (21) | |
| x | 0.30339 (9) | 0.30340 (10) | |
| \( x_{\text{neutron}} \) | 0.30338 (5) | ||
| GoF | 1.225 | ||
| R(F) | 0.018 | ||
| wR(F²) | 0.028 | ||
| N(reflections) | 755 | ||
| N(unique) | 303 | ||
| y_{min} | 0.87 |
The physical implications of the moment deficit will be discussed in §5.4.
4. Results
4.1. Standard structural parameters
4.1.1. \( \gamma \) -ray data. Scattering factors for \( Co^{2+} \) and \( F^{-} \) ions were calculated from Hartree–Fock wavefunctions expanded over Slater-type atomic orbitals (Clementi & Roetti, 1974). High-order refinements were carried out, taking into account only reflections with \( \sin\theta/\lambda > 0.6\ \mathring{A}^{-1} \) . The final scale factor was fixed in later refinements with improved scattering models. Refined structural parameters are listed in Tables 1 and 2. The RT results can be compared with those obtained from a recent synchrotron X-ray analysis (O'Toole & Streltsov, 2001). The close agreement between the two experimental methods is worthy of remark.
4.1.2. Neutron data. Errors from sources other than counting statistics dominate the uncertainties of the strong reflections. The reduced precision in individual reflections, however, is more than compensated by the very high degree of overdetermination, thus allowing accurate structural parameters to be derived. The goodness of fit S is 1.30 (RT) and 1.36 (LT). The refined fluorine nuclear x parameters are given in Tables 1 and 2. It is evident that there is excellent agreement between the \( \gamma \) -ray results and those obtained by neutron diffraction, with a considerable improvement in the standard deviations from the neutron work. There is thus no experimental indication for a polarization of the fluorine core electrons, as identified for antiferromagnetic \( MnF_{2} \) . Comparison of the neutron-derived thermal parameters with those obtained from \( \gamma \) -ray diffraction reveals that the neutron values are apparently too large at both temperatures. For the mean square vibrational amplitudes of the two atoms along axial directions: \( \sum_{i=1}^{6} U_{ii}(\text{neutron})/\sum_{i=1}^{6} U_{ii}(\gamma\text{-ray}) = 1.14 \) at RT and 1.21 at LT, respectively (for more details, see Jauch & Peters, 2001). A source of systematic error common to both
Table 2
LT result from high-order refinement with \( \sin\theta/\lambda\geq0.6\ \hat{A}^{-1} \)
\( x_{neutron} \) denotes the positional parameter as derived from neutron diffracton.
| Co | F | |
| \( U_{11} \) ( \( \mathring{A}^{2} \) ) \( ^{2} \) | 0.00185 (2) | 0.00416 (4) |
| \( U_{33} \) ( \( \mathring{A}^{4} \) ) \( ^{2} \) | 0.00157 (2) | 0.00320 (6) |
| \( U_{12} \) ( \( \mathring{A}^{4} \) ) \( ^{2} \) | -0.00004 (10) | -0.00156 (5) |
| x | 0.30326 (4) | |
| \( x_{neutron} \) | 0.30323 (2) | |
| GoF | 1.067 | |
| R(F) | 0.013 | |
| wR(F²) | 0.026 | |
| N(reflections) | 544 | |
| N(unique) | 337 | |
| y_{min} | 0.992 |
data sets may be associated with an inaccurate description of the spectral flux of the incoming neutrons. We therefore refrain from listing the corresponding thermal parameter values.
4.2. Electron density in the antiferromagnetic state
It was hoped that the RT \( \gamma \) -ray data would allow a charge-density analysis despite the severity of extinction arising from the narrow mosaic width of 7". The somehow irregular shape of the sample, however, introduces uncertainties in the absorption-weighted path lengths, which limit the reliability of the corresponding correction factors. An accurate charge-density analysis of paramagnetic \( CoF_{2} \) could thus not be realized.
The much increased mosaicity at LT implies reduced extinction effects that depend in a less sensitive manner on the different path lengths. A charge-density study of antiferromagnetic \( CoF_{2} \) is therefore not hampered by questionable correction factors.
In the aspherical-atom multipole model, the electron density of an atom is described by an expansion of nucleus-centred real spherical harmonic functions. For cobalt, the atomic density is represented as
\[ \rho_{\mathrm{C o}}(\mathbf{r})=\rho_{\mathrm{C o,c o r e}}(r)+\kappa^{3}R_{3d}(\kappa r)\sum_{l=0}^{4}\sum_{m=0}^{l}P_{l m\pm}\mathbf{y}_{l m\pm}(\mathbf{r}/r). \]
For fluorine,
\[ \begin{aligned}\rho_{\mathrm{F}}(\mathbf{r})&=\rho_{\mathrm{F,core}}(r)+P_{\mathrm{F,valence}}\kappa^{3}\rho_{\mathrm{F,valence}}(\kappa r)\\&\quad+\sum_{l=1}^{4}\kappa^{3}R_{l}(\kappa r)\sum_{m=0}^{l}P_{lm\pm}\mathbf{y}_{lm\pm}(\mathbf{r}/r).\end{aligned} \]
All symmetry-allowed multipoles up to the hexadecapole level were included in the refinements. The fluorine positional parameter was fixed at the neutron value so that the dipole term \( (l=1) \) was not affected by correlations. \( \rho_{Co,core} \) , \( \rho_{F,core} \) and \( \rho_{F,valence} \) are unperturbed HF electron densities of the appropriate atomic orbitals. \( \rho_{F,valence} \) is the average of the 2s and 2p orbitals, normalized to one electron. For Co, the square of the radial part of the 3d canonical HF orbitals is used to construct both monopole and multipoles, reflecting the fact that the deformation is essentially due to different d-orbital occu-
Table 3
Results from multipole refinements of antiferromagnetic \( CoF_{2} \)
| Co | F | |
| \( U_{11} \) ( \( \textup{\AA}^{2} \) ) | 0.00187 (1) | 0.00419 (6) |
| \( U_{33} \) ( \( \textup{\AA}^{2} \) ) | 0.0051 (2) | 0.00311 (8) |
| \( U_{12} \) ( \( \textup{\AA}^{2} \) ) | 0.0 | -0.00170 (8) |
| \( \chi_{\text{neutron}} \) | 0.30323 | |
| \( \kappa \) | 0.974 (3) | 0.990 (2) |
| \( P_{00} \) ( \( \textup{le} \) ) | 6.948 (28) | 8.026 (14) |
| \( P_{10} \) ( \( \textup{le} \) | \( \textup{\AA}^{2} \) ) | 0.154 (16) | |
| \( P_{20} \) ( \( \textup{le} \) | \( \textup{\AA}^{\textup{2}} \) ) | -0.32 (6) | 0.28 (9) |
| \( P_{22+} \) ( \( \textup{le} \) | \( \textup{\AA} \) ) | 0.00 (3) | 0.13 (4) |
| \( P_{30} \) ( \( \textup{le} \) | \( \textup{\AA}_{3} \) ) | -0.06 (2) | |
| \( P_{32+} \) ( \( \textup{le} \) | \( \textup{\A}^{3} \) ) | -0.08 (6) | |
| \( P_{40} \) ( \( \textup{le} \) | \( \textup{\AA}_{\textup{4}}^{\textup{4}} \) ) | -0.26 (6) | -0.02 (5) |
| \( P_{42+} \) ( \( \textup{le} \) | \( \textup{\AAA}^{\textup{4}} \) ) | 0.26 (5) | 0.05 (4) |
| \( P_{44+} \) ( \( \textup{le} \) | \( \textup{\AAAA}^{\textup{4}} \) ) | 0.27 (8) | 0.18 (5) |
| GoF | 1.354 | |
| \( R(F) \) | 0.0121 | |
| \( wR(F^{2}) \) | 0.0186 | |
| N(reflections) | 646 | |
| N(unique) | 376 | |
| \( y_{\textup{min}} \) | 0.837 | |
| Mosaic width ( \( ^{\prime\prime} \) ) | 27.8 (4) |
pancies. For F, the dipole and quadrupoles were constructed from \( 2s2p \) and \( 2p2p \) atomic orbital products. The l > 2 radial function of fluorine is a single Slater function, \( r^{4}\exp(-\alpha r) \) , with the standard exponent \( \alpha = 5.10 \) Bohr \( ^{-1} \) . The \( \kappa \) parameters allow for expansion ( \( \kappa < 1 \) ) or contraction ( \( \kappa > 1 \) ) of the radial functions. \( P_{F,valence} \) and \( P_{Im\pm} \) are variable population coefficients. Monopolar populations were constrained to ensure electroneutrality of the crystal. The spherical harmonics are expressed relative to a global Cartesian frame which is oriented with \( x\parallel[001] \) and \( z\parallel[110] \) . The results of the multipole refinement are presented in Table 3.

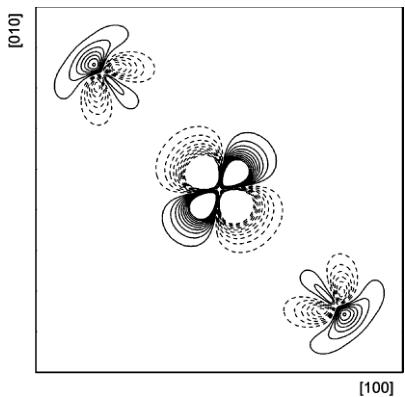
Figure 1
Aspherical contributions to the static model density in the \( (001) \) plane. Solid lines represent positive regions, dashed lines negative regions in steps of \( 0.1\ e\ \mathring{A}^{-3} \) . The zero contour is omitted. The densities are truncated at \( \pm1\ e\ \mathring{A}^{-3} \) . The density range is from -3.98 to 3.14 e \( \mathring{A}^{-3} \) . Co is located at the centre of the map.
The total number of 3d electrons on Co is found to be virtually identical with the formal value of 7. The corresponding numbers deduced for \( MnF_{2} \) , \( FeF_{2} \) and \( NiF_{2} \) from \( \gamma \) -ray data sets all came very close to the expected integer values. In contrast, considerable reductions were observed in the case of the transition-metal monoxides with a valence monopole population of 6.4 and 4.75 on the metal atom in CoO (Jauch & Reehuis, 2002) and MnO (Jauch & Reehuis, 2003). In MnO, where an orbital magnetic moment is absent, the population of the monopolar deformation can be directly compared with the absolute magnetic moment of \( 4.7 \mu_{B} \) as obtained from neutron diffraction. The close agreement between the \( \gamma \) -ray and neutron result supports the reliability of the multipole partitioning leading to physically meaningful valence-shell populations. From Table 3, it can be seen that the refined mosaicity (FWHM) is in satisfactory accordance with the observed rocking-curve widths thereby substantiating once more the standard model of extinction (for a recent discussion see Jauch & Palmer, 2002).
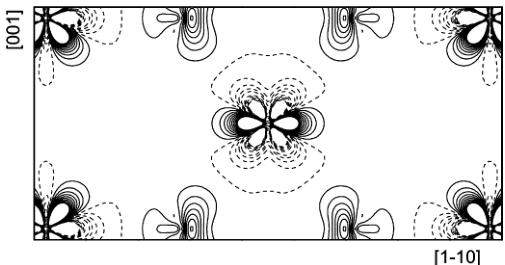
Figs. 1 and 2 show the static deformation densities (aspherical components only) calculated in direct space from the multipole model. The regions of excess density near the Co atom reflect the preferential occupation of certain d orbitals, whereas the destabilized orbitals are manifested by regions of electron deficiency. The density features around cobalt are in accord with those presented by O'Toole & Streltsov (2001). On the other hand, the present fluorine density is rather different from that observed by these authors. The prominent feature is a lone-pair charge buildup, which can be attributed to the highly significant dipole deformation pointing away from the nearest-neighbour cation. It should also be noted that the Co charge distribution is well reproduced by theory (Moreira et al., 2000).
4.3. Analysis of the bonding state
The theory of atoms in molecules (AIM) developed by Bader (1990) uses the electron density as its starting point and offers a powerful tool for characterizing the bonding state. According to this approach, presence and classification of a chemical bond are based on the saddle point (bond critical

Figure 2
Aspherical contributions to the static model density in the \( (1\bar{1}0) \) plane. Contours as in Fig. 1. The density range is from -3.95 to 3.63 e \( \mathring{A}^{-3} \) . Co is located at the centre and at the corners of the map.
Table 4
Characteristics of the bond critical points in antiferromagnetic \( CoF_{2} \)
| Values of \( \rho \) in \( \text{\AA}^{-3} \) , values of \( \nabla^{2}\rho \) and \( \lambda_{i} \) in \( \text{\AA}^{-5} \) . G, G/ \( \rho \) and V are given in atomic units. | ||||||
| \( \mathbf{r}_{c} \) | \( \rho(\mathbf{r}_{c}) \) | \( \nabla^{2}\rho(\mathbf{r}_{c}) \) | \( \lambda_{1,2,3} \) | \( G(\mathbf{r}_{c}) \) | \( G(\mathbf{r}_{c})/\rho(\mathbf{r}_{c}) \) | \( V(\mathbf{r}_{c}) \) |
| 0.149 (1), 0.149 (1), 0 | 0.406 (11) | 10.59 (3) | -2.22 (2) | 0.100 (1) | 1.66 (4) | -0.090 (2) |
| -1.51 (2) | ||||||
| 0.403 (3), 0.403 (3), 0.255 (4) | 0.391 (10) | 9.57 (15) | 14.32 (2) | 0.091 (2) | 1.57 (5) | -0.083 (3) |
| -1.89 (4) | ||||||
| -1.80 (4) | ||||||
| 13.26 (14) | ||||||
Table 5
Net atomic charges and volumes from AIM analyses of experimental charge densities derived from \( \gamma \) -ray diffraction data.
| q (|e|) | V (Å3) | ||
| CoF2 | Co | 1.73 | 8.46 |
| F | -0.86 | 13.28 | |
| MnF2 | Mn | 1.81 | 9.44 |
| F | -0.90 | 14.88 | |
| CoO | Co | 1.48 | 9.06 |
| O | -1.48 | 10.28 | |
| MnO | Mn | 1.23 | 10.40 |
| O | -1.23 | 11.57 |
point \( r_{c} \) of the electron density between two nuclei and on the value of the associated Laplacian, \( \nabla^{2}\rho(\mathbf{r}_{c})=\sum_{i=1}^{3}\lambda_{i} \) , where \( \lambda_{3} \) designates the bond-parallel and \( \lambda_{1} \) , \( \lambda_{2} \) are the bond-perpendicular curvatures. A large negative value of \( \nabla^{2}\rho(\mathbf{r}_{c}) \) is typical for shared-electron interaction (covalent bond), whereas unshared-electron interaction (ionic bond) is characterized by \( \nabla^{2}\rho(\mathbf{r}_{c})\gg0 \) combined with a low value of \( \rho(\mathbf{r}_{c}) \) .
Additional more quantitative information about the bond type can be obtained by consideration of local energetic properties. The Laplacian function of the electron density is related, through the local virial theorem, to the electronic kinetic energy density, \( G(\mathbf{r}) \) , and the electronic potential energy density, \( V(\mathbf{r}) \) : \( 2G(\mathbf{r}) + V(\mathbf{r}) = (\hbar^{2}/4m)\nabla^{2}\rho(\mathbf{r}) \) . The kinetic energy per electronic charge, the ratio \( G(\mathbf{r}_{\mathrm{c}})/\rho(\mathbf{r}_{\mathrm{c}}) \) , should be less than unity for covalent interactions and greater than unity for ionic interactions (when expressed in atomic units). \( G(\mathbf{r}_{\mathrm{c}}) \) can be evaluated from the model electron density: \( G(\mathbf{r}_{\mathrm{c}}) \cong 2.8713[\rho(\mathbf{r}_{\mathrm{c}})]^{5/3} + 0.16667\nabla^{2}\rho(\mathbf{r}_{\mathrm{c}}) \) with all quantities in atomic units (Abramov, 1997). In this relation, the first term represents the kinetic energy density of a homogeneous electron gas with density \( \rho(\mathbf{r}_{\mathrm{c}}) \) . The potential-energy contribution and consequently the total electronic energy density, \( H(\mathbf{r}_{\mathrm{c}}) = G(\mathbf{r}_{\mathrm{c}}) + V(\mathbf{r}_{\mathrm{c}}) \) , follow from the local virial theorem.
A bond-critical-point search and calculation of the properties of the charge density at these points were performed with the VALRAY program. The characteristics of the bond critical points are listed in Table 4. From inspection of the corresponding parameters, the bonding state in \( CoF_{2} \) is evidenced as purely ionic. It is found that \( H(\mathbf{r}_{\mathrm{c}}) \cong 0 \) , a result that has also been obtained with MnO and CoO. It has been demonstrated by Cremer & Kraka (1984) that, for a covalent bond, \( H(\mathbf{r}_{\mathrm{c}}) \) is dominated by \( V(\mathbf{r}_{\mathrm{c}}) \) and thus largely negative. Moreover, Cremer & Kraka (1984) suggested that the positive kinetic energy dominates in ionic bonding interactions, which should thus have positive values of \( H(\mathbf{r}_{\mathrm{c}}) \) . However, our experimental results strongly indicate that the ionic bond is characterized by the balance of the two local energy densities. Additional support for the present result comes from the critical-point characteristics presented by Abramov (1997).
Further bond critical points were found along the Co–Co lines at \( (0_{2}^{1}0) \) \( [\lambda_{1,2,3} = -0.03, -0.02, 0.39 \text{ e Å}^{-5}] \) , \( (00_{2}^{1}) \) \( [\lambda_{1,2,3} = -0.45, -0.04, 2.52 \text{ e Å}^{-5}] \) and along the F–F line at \( (\frac{11}{220}) \) \( [\lambda_{1,2,3} = -0.45,-0.04, 2.52 \text{ e Å}^{-5}] \) , which, however, are not well characterized in terms of the curvatures of the density. Neither ligand–ligand nor metal–metal bonding is therefore substantiated by experiment.
The AIM theory provides a unique partitioning of the total charge density into disjoint mononuclear regions, termed as atomic basins ( \( \Omega \) ), which are bound by a surface whose flux of the gradient vector field \( \nabla\rho(\mathbf{r}) \) vanishes. The electron population of an atom is obtained by integration of \( \rho(\mathbf{r}) \) over its basin. The net atomic charge, \( q(\Omega) \) , is the difference between the nuclear charge and the integrated electron population. The following results are based on the algorithm of Flensburg & Madsen (2000), which is implemented in the VALRAY system. The results of the integration over the atomic basins are presented in Table 5. The net charges turn out to be rather close to the fully ionic values. In addition, the integration results for the isostructural compound \( MnF_{2} \) as well as CoO and MnO are included. The summations of the atomic volumes and populations over the unit cell give \( V_{c} \) and \( F(000) \) to within 0.01–0.2% and 0.02–0.5%, respectively. The interatomic surfaces have thus been determined reliably. Flensburg & Madsen (2000) estimate the error in the integrated properties to be about 5%. The AIM partitioning gives identical interatomic charge transfer, within the error margin, for the two fluorides, whereas the monoxides exhibit quite distinct charge values. The very similar values for the fluorides must therefore be considered as fortuitous rather than reflecting transferability.
4.4. d-orbital populations
The 3d electron density may be described by multipole functions or, alternatively, it may be expressed in terms of the atomic orbitals \( d_{i} \) . Since the Co valence density has been constructed from a 3d3d radial product, there is a linear relationship between the multipole population and the
research papers
Table 6
Populations of the 3d orbital product density functions on Co for the natural coordinate systems.
System A: \( x \parallel [110] \) , \( y \parallel [001] \) ; system B: \( x \parallel [1\bar{1}0] \) , \( z \parallel [001] \) ; system C: \( x \parallel [001] \) , \( z \parallel [110] \) .
| System A | System B | System C | |
| \( d_{z^{2}} \) | 1.71 (7) | 1.35 (3) | 0.98 (7) |
| \( d_{x^{2}-y^{2}} \) | 0.98 (8) | 1.34 (3) | 1.71 (8) |
| \( d_{xy} \) | 1.76 (8) | 1.28 (3) | 1.22 (8) |
| \( d_{xz} \) | 1.28 (6) | 1.23 (9) | 1.76 (6) |
| \( d_{yz} \) | 1.22 (6) | 1.75 (9) | 1.28 (6) |
| \( d_{x^{2}-yz}d_{z^{2}} \) | 0.42 (8) | -0.85 (15) | 0.42 (8) |
Total Co 3d electrons: 6.95 (3)
d-orbital population coefficients (Holladay et al., 1983). The six multipole parameters transform into five population factors and a mixed-product term \( d_{x^{2}-y^{2}}d_{z^{2}} \) . The values obtained depend on the particular choice of the Cartesian coordinate system. Though the total density is invariant with respect to the coordinate system, an orientation that corresponds to small mixed-product terms is preferable because it allows straightforward interpretation of the d-population coefficients (Sabino & Coppens, 2003). There are three natural systems termed A, B and C in O'Toole & Streltsov (2001) with A: \( x \parallel [110] \) , \( y \parallel [001 \) ], B: \( x \parallel [1\bar{1}0] \) , \(z \parallel [001] \) and C: \( x \parallel [001] \) , \( z \parallel [110 \) ]. The calculated populations of the 3d orbitals for all systems are listed in Table 6.
As expected, the values for the orbitals not involved in mixing are just permuted in the three systems. In systems A and C, \( d_{x^{2}-y^{2}} \) and \( d_{z^{2}} \) are interchanged with identical values for the mixed term. In system B, the mixed term is large corresponding to an equal occupation of \( d_{x^{2}-y^{2}} \) and \( d_{x^{2}} \) . There are considerable differences between the O'Toole et al. populations and the present ones, which applies in particular to the mixed-product terms (a value close to zero is asserted for system A).
The multipole parameters in Table 3 refer to system C. In this system, the 3d populations according to the standard orientation in crystal field theory with x and y pointing towards the ligands are obtained by permuting the values for the \( d_{x^{2}-y^{2}} \) and \( d_{xy} \) orbitals. The x and y axes, however, are not exactly directed towards the fluorine ligands because of the rectangular distortion of the octahedral base plane. From all populations, those of the \( e_{g} \) orbitals are the lowest ones (0.98 and 1.22), as expected from crystal field theory. There are pronounced deviations from the spherical atom value of 1.4.
5. Discussion
5.1. Magnetic birefringence
In spite of the absence of a net magnetization in antiferromagnets, the optical linear birefringence varies strongly near the Néel temperature and a magnetic contribution occurs that is superimposed onto the natural birefringence of an optically anisotropic crystal. The magnetic birefringence in the transition-metal difluorides has been explained by one of the authors (Jauch, 1991) via a small exchange-induced internal
Table 7
Distortion parameter \(\Delta d = d_{\mathrm{eq}} - d_{\mathrm{ap}}\) for rutile-type difluorides in the paramagnetic and the magnetically ordered state, calculated with internal coordinates from single-crystal time-of-flight neutron diffraction.
| T | \( \Delta d(\text{MnF}_2) \) ( \( \text{\AA} \) ) | \( \Delta d(\text{FeF}_2) \) ( \( \text{\AA} \) ) | \( \delta d(\text{CoF}_2) \) ( \( \text{\AA} \) ) | \( \lambda d(\text{NiF}_2) \) ( \( \text{\AA} \) ) |
| 295 K | 0.0305 (3) | 0.1143 (5) | 0.0421 (6) | 0.0142 (4) |
| 15 K | 0.0300 (2) | 0.1138 (4) | 0.0412 (3) | 0.0149 (6) |
displacement of the anions. The causal connection has been validated for \( MnF_{2} \) and \( NiF_{2} \) . For \( CoF_{2} \) , the magnetostrictive shift of the fluorine positional parameter has been predicted to be \( \Delta x = x(\mathrm{RT}) - x(\mathrm{LT}) = 1.0 \times 10^{-4} \) , which is considerably smaller than in the other fluorides. The mean value from the various experiments is \( \Delta x = 1.5 (4) \times 10^{-4} \) , thus confirming the structural origin of magnetic birefringence also for \( CoF_{2} \) .
5.2. Magnetostriction
In the rutile structure, the distortions of the coordination octahedra of the ligands around the cations can be expressed in terms of the differences between the four equatorial distances \( d_{eq} \) and the two apical distances \( d_{ap} \) , representing basal spacing and height of the octahedron, respectively. A summary of the distortion parameters, \( \Delta d = d_{eq} - d_{ap} \) , as obtained from neutron-determined internal positions, is presented in Table 7. In all cases, the coordination octahedra are observed to be apically compressed. According to Dunitz & Orgel (1960), from the standpoint of the Jahn–Teller effect, the octahedron in \( CoF_{2} \) should be elongated. Actually, however, the reverse is true. Magnetostriction in rutile-type difluorides turns out to follow a remarkably simple scheme: the lattice constants a, c and the positional parameter x conspire in such a way that \( \Delta d \) , the bond delta, does not change as magnetic ordering occurs.
5.3. Atomic charges
It has sometimes been doubted whether the populations of monopolar deformation functions (monopole charges) represent physically meaningful charges. Furthermore, it has been argued that the AIM analysis provides a more rigorous and unambiguous definition of atomic charges. In open-shell systems, however, the two partitioning schemes represent different physical aspects. The monopole charge yields information on the partially filled orbitals of the valence shell whereas the AIM charge from the total electron density characterizes the ionicity with the bond strength increasing in proportion to the product of the charges.
5.4. Spin and orbital magnetic moment
From neutron diffraction, the total magnetic moment, proportional to the sum \( 2S + L \) , is accessible. At energies above 100 keV, the magnetic photon cross section depends only on the spin component perpendicular to the scattering plane. Thus, a combination of both techniques offers a possibility of separating spin and orbital contributions to the magnetic moment. A pure spin magnetic moment of
2.21 (2) \( \mu_{B} \) was determined in \( CoF_{2} \) using high-energy synchrotron radiation (Strempfer et al., 2003). It is considerably smaller than the moment of \( 3 \mu_{B} \) that is expected for the S = 3/2 state. In view of the integer monopole charge on Co, the spin reduction cannot be related to charge-transfer effects as observed in MnO and CoO, for example. The moment will be reduced by zero-point spin motion, this reduction should be small and can therefore be neglected here.
If the spin–orbit interaction energy is treated as a second-order perturbation, the single-ion crystal-field term in the spin Hamiltonian has the form \( D S_{z}^{2} + E(S_{x}^{2} - S_{y}^{2}) \) , with D and E being anisotropy parameters arising from spin–spin interactions within the magnetic ion. For E > D, the average spin per site will be reduced. For \( CoF_{2} \) , it has been found that E = 1.8D, and the spin moments of 2.18 and 2.12 \( \mu_{B} \) have been obtained from molecular field theory and spin wave theory, respectively (Lines, 1965). These theoretical values are remarkably close to the observed one.
If collinearity is assumed, the orbital magnetic moment is therefore \( \mu_{L}=0.4\;\upmu_{B} \) , which leads to an orbital-to-spin angular momentum ratio of L/S=0.4 (as compared with L/S=2 for the free atom). From form-factor calculations, an orbital contribution to the total magnetic moment of 23% has been predicted (Khan et al., 1981), which is in fair agreement with the experimental value of 15%. Density functional theory has been applied to \( CoF_{2} \) by Dufek et al. (1994). Only within the generalized gradient approximation is an insulating ground state found, and the spin magnetic moment is \( 2.62\;\upmu_{B} \) , which is large compared to experiment. A different ab initio approach using the periodic Hartree-Fock scheme was performed by Moreira et al. (2000), who derive an even larger spin moment of \( 2.94\;\upmu_{B} \) from a Mulliken population analysis. The origin of the failure of both computational methods to reproduce a basic ground-state property such as the spin magnetic moment can be traced back to the neglect of the relativistic spin-orbit interaction.
The case for \( CoF_{2} \) should be contrasted with \( FeF_{2} \) for which the parameter E in the single-ion anisotropy Hamiltonian is negligible compared with D (Lines, 1967), and therefore no resulting spin moment reduction should occur. From high-energy magnetic X-ray scattering, the ideal value of the spin moment, 4.01 (5) \( \upmu_{B} \) , has indeed been observed (Strempfer et al., 2001). The charge-density study gave an Fe-atom 3d population of 5.92 (5) electrons, i.e. absence of charge transfer towards the ligands. The conclusions from magnetic and charge scattering are thus fully consistent with each other. These findings are in contradiction to results obtained by Brown et al. (1990), who suggested a spin transfer of at least 10% from Fe onto the ligands in order to explain polarized neutron diffraction data.
6. Concluding remarks
With the present study, the detailed investigation of the electron-density distribution in magnetically ordered transition-metal difluorides has been completed. Accurate internal positional parameters provided further insight into the microscopic origin of magnetic birefringence and revealed the rule that governs magnetostriction in rutile-type compounds. For the whole series investigated, the Me–F interactions were found to be purely ionic; the 3d orbital populations confirmed the expectations from crystal field theory. Finally, an unusually small total magnetic moment has been observed on Co, which nevertheless contains a significant contribution due to orbital motion.
We are grateful to Dr H.-J. Bleif for helpful discussions and support; to H. O. Sørensen for evaluation of the AIM charges; and to Dr D. Többens for assistance during the neutron powder experiment. The work at Argonne National Laboratory was supported by the US Department of Energy, Basic Energy Sciences–Materials Sciences, under Contract No. W-31-109-ENG-38.
References
Abramov, Yu. A. (1997). Acta Cryst. A53, 264–272.
Bader, R. F. W. (1990). Atoms in Molecules: a Quantum Theory. Oxford: Clarendon Press.
Becker, P. J. & Coppens, P. (1975). Acta Cryst. A31, 417–425.
Brown, P. J., Figgis, B. N. & Reynolds, P. A. (1990). J. Phys. Condens. Matter, 2, 5297–5308.
Clementi, E. & Roetti, C. (1974). At. Data Nucl. Data Tables, 14, 177–478.
Cremer, D. & Kraka, E. (1984). Croat. Chem. Acta, 57, 1259–1281.
Dufek, P., Blaha, P., Sliwko, V. & Schwarz, K. (1994). Phys. Rev. B, 49, 10170–10175.
Dunitz, J. D. & Orgel, L. E. (1960). Adv. Inorg. Chem. Radiochem. 2, 1–60.
Flensburg, C. & Madsen, D. (2000). Acta Cryst. A56, 24–28.
Haefner, K. (1964). PhD thesis, University of Chicago, USA.
Hall, S. R., King, G. S. D. & Stewart, J. M. (1995). Xtal3.4 User's Manual, University of Western Australia, Australia.
Holladay, A. M., Leung, P. & Coppens, P. (1983). Acta Cryst. A39, 377–387.
Jauch, W. (1991). Phys. Rev. B, 44, 6864–6869.
Jauch, W. & Palmer, A. (2002). Acta Cryst. A58, 448–450.
Jauch, W. & Peters, J. (2001). J. Appl. Cryst. 34, 493–495.
Jauch, W. & Reehuis, M. (2002). Phys. Rev. B, 65, 125111-1-7.
Jauch, W. & Reehuis, M. (2003). Phys. Rev. B, 67, 184420-1-8.
Jauch, W., Schultz, A. J. & Stewart, R. F. (1999). Phys. Rev. B, 59, 373–380.
Khan, D. C., Kirtane, S. M. & Sharma, J. K. (1981). Phys. Rev. B, 23, 2697–2709.
Lines, M. E. (1965). Phys. Rev. 137, A982–A993.
Lines, M. E. (1967). Phys. Rev. 156, 543–551.
Moreira, I. de P. R., Dovesi, R., Roetti, C., Saunders, V. R. & Orlando, R. (2000). Phys. Rev. B, 62, 7816–7823.
O'Toole, N. J. & Streltsov, V. A. (2001). Acta Cryst. B57, 128–135.
Palmer, A. & Jauch, W. (1993). Phys. Rev. B, 48, 10304–10310.
Popa, N. C. & Willis, B. T. M. (1997). Acta Cryst. A53, 537–545.
Sabino, J. & Coppens, P. (2003). Acta Cryst. A59, 127–131.
Sears, V. F. (1995). International Tables for Crystallography, Vol. C, edited by A. J. C. Wilson, pp. 383–391. Dordrecht: Kluwer.
Stewart, R. F., Spackman, M. A. & Flensburg, C. (2000). VALRAY User's Manual. Carnegie-Mellon University, Pittsburgh, USA, and University of Copenhagen, Denmark.
Strempfer, J., Rütt, U., Bayrakci, S., Brückel, Th. & Jauch, W. (2003). Phys. Rev. B. In the press.
Strempfer, J., Rütt, U. & Jauch, W. (2001). Phys. Rev. Lett. 86, 3152–3155.
 p4_0.jpg
 p4_1.jpg