| Transition Temperature | 195 K |
|---|---|
| Experiment Temperature | 1.4 K |
| Propagation Vector | k1 (0, 0, 0) |
| Parent Space Group | Pnma (#62) |
| Magnetic Space Group | Pnma (#62.441) |
| Magnetic Point Group | mmm (8.1.24) |
| Lattice Parameters | 7.51520 6.39480 7.17160 90.00 90.00 90.00 |
|---|---|
| DOI | 10.1007/s100510170093 |
| Reference | N.E. Khayati, R.C.E. Moursli, J. Rodriguez-Carvajal, G. Andre, N. Blanchard, F. Bouree, G. Collin and T. Roisnel, The European Physical Journal B (2001) 22 429-442. |
| Label | Element | Mx | My | Mz | |M| |
|---|---|---|---|---|---|
| Cu1 | Cu | 0.0 | 0.95 | 0.0 | 0.95 |
| Fe1 | Fe | 0.0 | 4.28 | 0.0 | 4.28 |
Crystal and magnetic structures of the oxyphosphates MFePO_{5} (M = Fe, Co, Ni, Cu). Analysis of the magnetic ground state in terms of superexchange interactions
N. El Khayati \( ^{1,2} \) , R. Cherkaoui El Moursli \( ^{1} \) , J. Rodríguez-Carvajal \( ^{2,a} \) , G. André \( ^{2} \) , N. Blanchard \( ^{2} \) , F. Bourée \( ^{2} \) , G. Collin \( ^{2} \) , and T. Roisnel \( ^{2} \)
\( ^{1} \) Faculté des Sciences, Département de Physique, Av. Ibn Batouta, BP 1014 Rabat, Maroc
\( ^{2} \) Laboratoire Léon Brillouin (CEA-CNRS), CEA/Saclay, 91191 Gif-sur-Yvette Cedex, France
Received 15 December 2000 and Received in final form 25 June 2001
Abstract. We have studied in detail the crystal and magnetic structures of the oxyphosphates MFePO \( _{5} \) (M: divalent transition metal) using neutron powder diffraction as a function of temperature. All of them are isomorphic to the mixed valence compound \( \alpha \) -Fe \( _{2} \) PO \( _{5} \) with space-group Pnma. No disorder exists between the two metallic sites. The \( M^{2+}O_{6} \) octahedra share edges between them and faces with Fe \( ^{3+} \) O \( _{6} \) octahedra building zigzag chains running parallel to the b-axis that are connected by PO \( _{4} \) tetrahedra. The topology of this structure gives rise to a complex pattern of super-exchange interactions responsible for the observed antiferromagnetic order. The magnetic structures are all collinear with the spin directed along the b-axis except for M = Co. The experimental magnetic moments of Cu \( ^{2+} \) and Ni \( ^{2+} \) correspond to the expected ionic value, on the contrary the magnetic moment of Fe \( ^{3+} \) is reduced, probably due to covalence effects, and that of Co \( ^{2+} \) is greater than the spin-only value indicating a non-negligible orbital contribution. Using numerical calculations we have established a magnetic phase diagram adapted for this type of crystal structure and determined the constraints to be satisfied by the values of the exchange interactions in order to obtain the observed magnetic structure as the ground state.
PACS. 61.12.-q Neutron diffraction and scattering – 61.66.Fn Inorganic compounds – 75.25.+z Spin arrangements in magnetically ordered materials (including neutron and spin-polarized electron studies, synchrotron-source x-ray scattering, etc.) – 75.30.Et Exchange and superexchange interactions
1 Introduction
Transition metal oxides are of current considerable interest within the community of solid state scientists (see, for instance \( [1] \) , and references therein). The reason is mainly related to the remarkable macroscopic properties that show many of these materials: superconductivity in many copper oxides, giant magnetoresistance in manganese perovskites, charge and orbital ordering, etc. From a more fundamental point of view new oxide materials display a plethora of interesting magnetic properties related with either low dimensionality (Spin-Peierls \( CuGeO_{3} \) , Haldane gap in \( Y_{2}BaNiO_{5} \) ) or frustration effects (pyrochlores with AF interactions, spin-ice materials) giving rise to exotic magnetic ground states. The understanding of complex electronic and magnetic properties in materials where electrons are in the edge of an itinerant to localised transition needs a clear knowledge of the fundamental magnetic properties of more simple materials as are the electronic insulators possessing transition metals. Phosphate and oxyphosphate materials are quite close to oxides and are, in general, wider gap insulators. Mixed valence phosphates and oxyphosphates present a stronger trend towards charge localisation than pure oxides. The case of \( \alpha-Fe_{2}PO_{5} \) [2,3] is a well known example of charge ordered material at room temperature and it is at the origin of the work we present in this paper.
Concerning the class of insulators, we have initiated a long term project in order to study the magnetic properties of phosphates and oxyphosphates having coexisting M-O-M' super-exchange and super-super-exchange (M-O-O-M') magnetic interactions mediated eventually by phosphate groups \( \left(\mathrm{MO}_{\mathrm{n}}\mathrm{-PO}_{4}\mathrm{-M}^{\prime}\mathrm{O}_{\mathrm{m}}\right) \) . Our ultimate aim is to investigate the relative strength of the exchange integrals in these materials and to check the consistency with the empirical Goodenough-Kanamori-Anderson [4–6] rules about the sign and strength of the superexchange interactions. For that goal we need, as a first step, the determination of the magnetic structure of the phosphate
materials. Neutron powder diffraction is the technique of choice for such a kind of investigations and we have used it for the study of the compounds \( M^{2+}Fe^{3+}PO_{5} \) , with \( M^{2+}=Co^{2+}, Cu^{2+}, Ni^{2+} \) and compare the results with those already known for \( \alpha-Fe_{2}PO_{5} \) [2,3].
The compound \( \alpha-Fe_{2}PO_{5} \) was studied, twenty years ago, using single crystal diffraction by Modaressi et al. [2], and its structure was determined to be orthorhombic with space group Pnma and Z = 4. Its magnetic structure was more recently solved by Warner et al. [3] and the magnetic moments of both iron sites was proposed to be in a collinear antiferromagnetic arrangement with spin aligned along the b-axis. The \( M^{2+}Fe^{3+}PO_{5} \) compounds ( \( M^{2+} = Co^{2+}, Cu^{2+}, Ni^{2+} \) ) have been previously synthesised by Touaïher [7,8] and found to be isomorphic to \( \alpha-Fe_{2}PO_{5} \) . To our knowledge, no neutron scattering experiments have been published so far on these compounds. Touaïher et al. [7] mention an overall anti-ferromagnetic behaviour for \( MFePO_{5} \) (M = Cu, Ni) based on susceptibility measurements. We used the information obtained from susceptibility data for planning our neutron diffraction experiments as a function of temperature and determine the magnetic structure of these compounds. Once we have determined the magnetic structures of all these compounds, and collected all the relevant data from literature, we have performed numerical calculations in order to get insight into the relative strength of the exchange interactions responsible for the observed magnetic ground state. To perform the calculations we have considered only isotropic exchange interactions, because anisotropy is expected to be relatively weak and contributes merely to orient the whole spin configuration with respect to the crystal lattice.
This paper is organised as follows: an experimental section (Sect. 2) describes the synthesis of the materials and the experimental methods used throughout this work, in Section 3 we describe the crystal structure, in Section 4 we discuss the determination of the magnetic structures and in Section 5 we describe the numerical calculations and the results we have obtained concerning the analysis of the magnetic structures and the phase diagram. Finally, in Section 6, we state some remarks and conclusions.
2 Experimental
The MFePO_{5} powders were prepared by mixing stoichiometric quantities of MO or CoCO_{3} and FePO_{4} according to:
\[ \begin{aligned}MO+FePO_{4}\rightarrow MFePO_{5}\quad&(M=Ni,Cu)\\ CoCO_{3}+FePO_{4}\rightarrow CoFePO_{5}+CO_{2}\uparrow.\end{aligned} \]
The mixture was heated at \( 850^{\circ} \) C (respectively \( 950^{\circ} \) C and \( 1000^{\circ} \) C) for Cu (respectively Ni and Co) for two days. Different intermediate temperature treatments and grindings were performed. The \( FePO_{4} \) powder was prepared from stoichiometric amounts of \( Fe_{2}O_{3} \) and \( (\mathrm{NH}_{4})_{2}\mathrm{HPO}_{4} \) following the reaction:
\[ \frac{1}{2}\mathrm{Fe}_{2}\mathrm{O}_{3}+(\mathrm{NH}_{4})_{2}\mathrm{HPO}_{4}\rightarrow\mathrm{FePO}_{4}+2\mathrm{NH}_{3}\uparrow+\frac{3}{2}\mathrm{H}_{2}\mathrm{O}\uparrow. \]
The mixture was heated progressively to \( 800\ ^{\circ}C \) for 24 hours.
MFePO_{5} can also be alternatively obtained by mixing MO or Co_{3}O_{4}, Fe_{2}O_{3} and (NH_{4}){2}HPO{4} together according to:
\[ \begin{aligned}\frac{1}{3}\mathrm{Co}_{3}\mathrm{O}_{4}+\frac{1}{2}\mathrm{Fe}_{2}\mathrm{O}_{3}+(\mathrm{N}\mathrm{H}_{4})_{2}\mathrm{HPO}_{4}\rightarrow\\\mathrm{CoFePO}_{5}+2\mathrm{NH}_{3}\uparrow+\frac{3}{2}\mathrm{H_{2}O}\uparrow+\frac{1}{6}\mathrm{O_{2}}\uparrow\end{aligned} \]
\[ \begin{aligned}MO+\frac{1}{2}Fe_{2}O_{3}+(NH_{4})_{2}HPO_{4}\rightarrow\\ MFePO_{5}+2NH_{3}\uparrow+\frac{3}{2}H_{2}O\uparrow\quad(M=Ni,Cu).\end{aligned} \]
Both kind of synthesis routes have been used in this work. Both routes give rise to identical type of compounds. The final samples were checked by X-ray powder diffraction before performing the neutron diffraction experiments.
Neutron powder diffraction measurements were performed in two high-resolution powder diffractometers: G4-2 (wavelength: 2.343 Å) and 3T2 (wavelength: 1.223 Å), that served for refinement of the crystal structure. To analyse the behaviour of the diffraction patterns as a function of temperature we used the high flux two-axis diffractometer G4-1 (wavelength: 2.426 Å). All diffractometers belong to the Laboratoire Léon Brillouin (LLB, Saclay, France). The high resolution data allowed us to refine the crystal structure of the materials at room temperature (RT), we verified with additional measurements at low temperature in G4.2 that the structure does not change significantly (except for the cell parameters) so only the RT data are presented in this paper. A second set of measurements was performed, for each sample, on G4-1 allowing us to study the magnetic structures as a function of temperature. The compounds were measured in the following temperature ranges: CoFePO \( _{5} \) in the range 1.4–219 K, NiFePO \( _{5} \) in the range 1.5–219 K and CuFePO \( _{5} \) in the range 1.4–224 K. The treatment of the powder diffraction data was performed using the Rietveld method [9], as implemented in the program FullProf [10].
The numerical calculations, concerning the magnetic phase diagram as a function of the exchange interactions, have been performed using the programs SIMBO and ENERMAG developed by one of the authors \( [11] \) and shortly described in the Appendix.
3 Crystal structures of the compounds MFePO_{5}
The neutron powder diffraction patterns of MFePO_{5} measured on G4-2 (M = Ni, Cu) and 3T2 (M = Co) at room

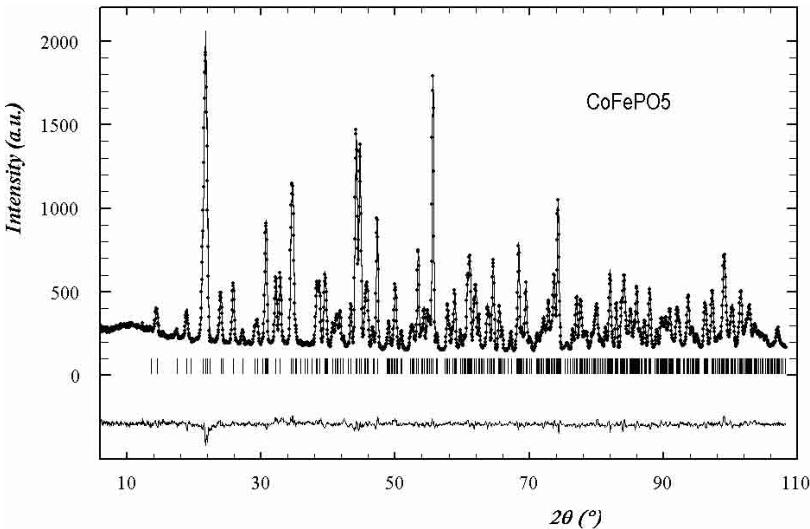
Fig. 1. Observed (circles) versus calculated (continuous line) neutron powder diffraction pattern of the \( CoFePO_{5} \) ( \( \lambda \approx 1.22 \AA \) ) compound at room temperature. Positions of the Bragg reflections are represented by vertical bars. The difference (obs-calc) pattern is displayed in the bottom of the figure.
temperature were used to refine the crystallographic structure of the compounds. We used the structural data obtained for \( \alpha \) -Fe \( _{2} \) PO \( _{5} \) [2] as starting atomic positions for the refinements. The agreement of the calculated versus observed patterns was reasonably good for all cases. Some small peaks were not indexed and they belong to unknown impurities, their influence in the refined patterns was negligible. In Figure 1 it is shown an example of final Rietveld refinement. The results confirm the isomorphism with \( \alpha \) -Fe \( _{2} \) PO \( _{5} \) . All the obtained structural parameters, as well as those of \( \alpha \) -Fe \( _{2} \) PO \( _{5} \) for comparison, are listed on Table 1. The atomic thermal parameter of the compounds with Cu and Ni, measured on G4-2, are less precise than those of the Co compound, measured on 3T2, because the limited Q-range, due to the larger wavelength. However, the atom positions in all cases are of enough precision for our main purpose: the analysis of the magnetic structures.
The crystal structure for all compounds can be shortly described as follows: the phosphorus atoms are at the centre of \( PO_{4} \) tetrahedra that are not connected between them. The \( M^{2+} \) and \( Fe^{3+} \) ions are in the centre of distorted octahedra. The \( M^{2+}O_{6} \) octahedra share edges and build chains parallel to the b-axis; the octahedra \( Fe^{3+}O_{6} \) are alternatively connected on both sides of these chains, sharing faces with \( M^{2+}O_{6} \) octahedra and they are connected with the \( PO_{4} \) tetrahedra. In fact the structure can be described as zigzag chains along b of alternating \( M^{2+}O_{6} \) and \( Fe^{3+}O_{6} \) octahedra sharing a face. The phosphorus atoms occupy interstitial tetrahedra between

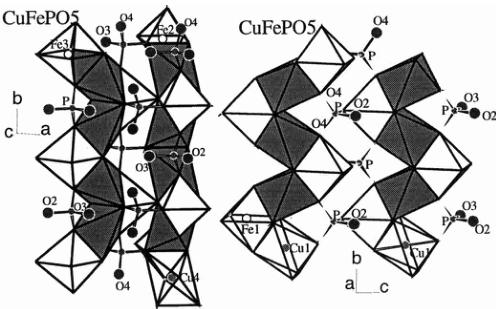
Fig. 2. Crystal structure of the MFePO \( _{5} \) compounds: Two orientations showing the connections between the zigzag chains of face sharing MO \( _{6} \) and FeO \( _{6} \) octahedra for the case of CuFePO \( _{5} \) .
adjacent chains. The adjacent chains share also the oxygen O(1) that is an important element for the exchange interactions in these compounds. In Figure 2 we present two views of the crystal structure emphasising the zigzag chains for the most distorted case: \( CuFePO_{5} \) .
Table 1. Atomic positions, cell parameters and temperature factors of MEPOs compounds (M = Fe, Co, Ni and Cu) at room temperature. The space group is Pmma. Structural parameters of \( \alpha \) -Fe \( _{2} \) PO \( _{3} \) have been taken from reference [1] and gathered here for comparison purposes.
| Space group | FePO3 [1] | CeFeO3 | NiFeO3 | CuFeO3 | ||||
| a (Å) | b (Å) | c (Å) | B (Å3) | Cell Volume (Å3) | Cell Parameters (nm) (No 62) | Cell Parameters (nm) (No 62) | Cell Parameters (nm)(No 62) | |
| Atom | x/a | y/b | z/c | B (Å3) | x/a | y/b | z/c | B (Å3) (Å3) |
| M | 0 | 0 | 0.50(1) | 0 | 0 | 0.14(6) | 0 | 0 |
| Fe | 0.153(1) | 0.172(1) | 0.40(1) | 0.1502(2) | 4 | 0.112(2) | 0.153(2) | 4 |
| P | 0.374(2) | 0.126(2) | 0.25(2) | 0.2360(3) | 4 | 0.139(3) | 0.151(3) | 4 |
| O1 | 0.408(4) | 0.642(2) | 0.51(2) | 0.540(1) | 4 | 0.547(2) | 0.647(2) | 4 |
| O2 | 0.214(5) | 0.0051(1) | 0.66(3) | 0.5026(3) | 4 | 0.158(3) | 0.72(4) | 4 |
| O3 | 0.050(5) | 0.477(5) | 0.80(3) | 0.0505(3) | 4 | 0.457(3) | 0.90(4) | 4 |
| O4 | 0.362(3) | 0.0597(3) | 0.252(3) | 0.0582(2) | 0.2822(2) | 0.70(2) | 0.76(3) | 0.0696(4) |
\( ^{2} \) : Bragg contribution
Table 2. Most important \( M^{2+}-O \) , \( Fe^{3+}-O \) and \( P^{5+}-O \) distances and bond valence sums around cations in \( MFePO_{5} \) (M = Fe, Co, Ni et Cu) compounds. The distortion parameter of a polyhedron \( BO_{N} \) with an average B-O distance \( \langle d\rangle \) , is here calculated using the formula: \( \Delta = (1/N) \sum_{n=1,N} \{(d_{n} - \langle d \rangle) / \langle d \rangle\}^{2} \) .
| Compound | \( \alpha \) -FeFePO \( _5 \) [2] | CoFePO \( _5 \) | NiFePO \( _5 \) | CuFePO \( _5 \) |
| Bond | Distance(Å) | Distance(Å) | Distance(Å) | Distance(Å) |
| M-O1 | 2.061 (2) | 2.079 (1) | 2.067 (3) | 1.969 (2) |
| M-O1 | 2.061 (2) | 2,079 (1) | 2.067 (3) | 1.969 (2 |
| M-O2 | 2.237 (2) | 2.188 (2) | 2.130 (3) | 2.358 (2) |
| M-O2 | 2.237 (2) | 2.118 (2) | 2.130 (3) | 2.358 (2) (2) |
| M-O4 | 2.126 (2) | 2.066 (2) | 2.043 (3) | 2.001 (2) |
| M-O4 | 2.126 (2) | 2.066 (2) | 2.043 (3) | 2.001 (2) |
| M-O4 | 2.126 (1) | |||
| R(O \( ^{2+} \) )+R(M \( ^{2+} \) ) [Å] | 2.18 | 2.145 | 2.09 | 2.13 |
| Average distance | 2.141 (2) | 2.111 (2) | 2.080 (3) | 2.109 (2) |
| Distortion | 11.546 10 \( ^{-4} \) | 6.698 10 \( ^{-4} \) | 3.124 10 \( ^{-4} \) | 69.787 10 \( ^{-4} \) |
| Valence sum | 2.03 (1) | 1.95 (1) | 1.91 (1) | 2.07 (1) |
| Fe-O1 | 1.885 (3) | 1.878 (2) | 1.887 (4) | 1.883 (4) |
| Fe-O1 | 2.170 (3) | 2.097 (2) | 2.079 (4) | 2.267 (4) |
| Fe-O2 | 2.223 (4) | 2.304 (2) | 2.406 (4) | 2.085 (4) |
| Fe-O3 | 1.917 (4) | 1.901 (3) | 1.899 (4) | 1.911 (3) |
| Fe-O4 | 2.026 (2) | 2.023 (1) | 2.006 (2) | 2.020 (2) |
| Fe-O4 | 2.026 (2) | 2,023 (1) | 2.006 (2) | 2.020 (2 |
| Average distance | 2.041 (3) | 2.038 (2) | 2.047 (4) | 2.031 (3) |
| Distortion | 35.892 10 \( ^{-4} \) | 47.826 10 \( ^{-4} \) | 71.956 10 \( ^{-4} \) | 38.423 10 \( ^{-4} \) |
| Valence sum | 2.95 (2) | 3.01 (1) | 3.01 (2) | 3.03 (1) |
| P-O2 | 1.550 (4) | 1.538 (3) | 1.549 (6) | 1.530 (4) |
| P-O3 | 1.509 (4) | 1.514 (3) | 1.506 (6) | 1.515 (4) |
| P-O4 | 1.533 (2) | 1.542 (2) | 1.532 (4) | 1.545 (3) |
| P-O4 | 1.533 (2) | 1,542 (2) | 1.532 (4) | 1.545 (3 |
| Average distance | 1.531 (3) | 1.534 (3) | 1.530 (5) | 1.534 (4) |
| Distortion | 0.891 10 \( ^{-4} \) | 0.690 10 \( ^{-4} \) | 0.998 10 \( ^{-4} \) | 0.675 10 \( ^{-4} \) |
| Valence sum | 5.05 (3) | 5.01 (2) | 5.06 (3) | 5.01 (3) |
| M-Fe x 2 | 2.923 (1) | 2.901 (1) | 2.903 (2) | 2.917 (2) |
| M-Fe x 2 | 3.397 (2) | 3.395 (1) | 3.391 (2) | 3.302 (2) |
| M-M x 2 | 3.223 (2) | 3.223 (1) | 3.196 (1) | 3.197 (1) |
| Fe-Fe x 2 | 3.732 (2) | 3.673 (2) | 3.650 (4) | 3.796 (3) |
| M-P x 2 | 3.326 (2) | 3.283 (2) | 3.251 (4) | 3.204 (3) |
| M-P x 2 | 3.366 (2) | 3.325 (2) | 3.291 (4) | 3.461 (3) |
The most important \( M^{2+}-O \) and \( Fe^{3+}-O \) distances, as well as the bond valence sums (BVS) [12] around the cations, are gathered in Table 2. In the case of the Cu compound, the \( M^{2+}O_{6} \) octahedra are much more distorted than in the other compounds, presumably this is due to the Jahn-Teller effect associated with \( Cu^{2+} \) ions. The BVS agree well to what is expected in these compounds, showing that there is no disorder between \( Fe^{3+} \) and \( M^{2+} \) .
4 Determination of the magnetic structures
Let start with a brief discussion about the macroscopic magnetic properties. Touaiher et al. [7,8] have reported susceptibility data on the Co, Ni and Cu compounds. Susceptibility data from \( \alpha \) -Fe \( _{2} \) PO \( _{5} \) are known from reference [2] and a recent study, analysing the susceptibility above the Néel temperature, has been published by Chemseddine and El Hajbi [13]. In Table 3 all the available macroscopic measurements are summarised. The susceptibility of all compounds indicates an overall antiferromagnetic behaviour but in the case of CoFePO \( _{5} \) the antiferromagnetism is accompanied by a weak ferromagnetic component. The suggested Néel temperatures from susceptibility data were used to plan the neutron diffraction experiments. The negative value of the paramagnetic Curie temperature indicates predominant antiferromagnetic interactions for all
Table 3. Paramagnetic Curie temperatures, Néel temperatures, and Curie constants for MFePO_{5} (M= Fe, Co, Ni et Cu) compounds.
| Compound | \( \theta_{\mathrm{p}} \) (K) | \( C_{\mathrm{exp}} \) ( \( \upmu \) em K/mol) | \( C_{\mathrm{el}} \) (L=0) ( \( \upmu \) em K/mol) | Néel Temperature \( T_{\mathrm{N}} \) (K) | |
| Literature | This work | ||||
| Fe \( _{2} \) PO \( _{5} \) [2] | -350 | 7.12 | 7.38 | 250 | |
| CoFePO \( _{5} \) [8] | -200 | 6.80 | 6.25 | 165 | 175 (5) |
| NiFePO \( _{5} \) [7] | -540 | 7.14 | 5.38 | 176 | 178 (5) |
| CuFePO \( _{5} \) [7] | -650 | 5.98 | 4.75 | 182 | 195 (5) |
compounds. The particular antiferromagnetic ordering is due to some exchange interactions that we shall try to identify after the analysis of the magnetic structures.
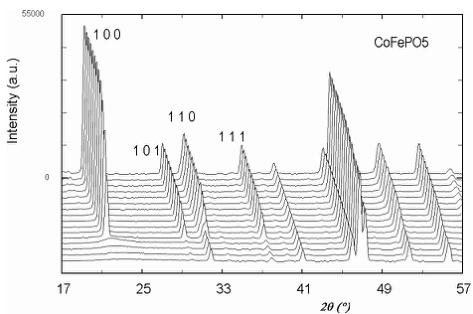
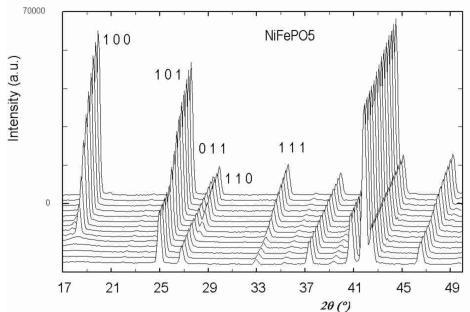
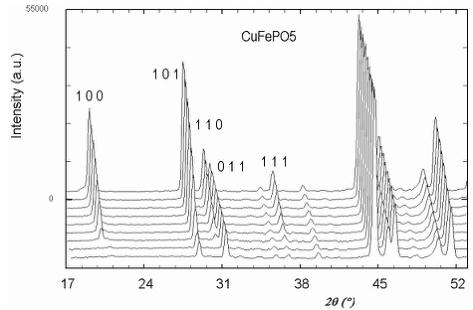
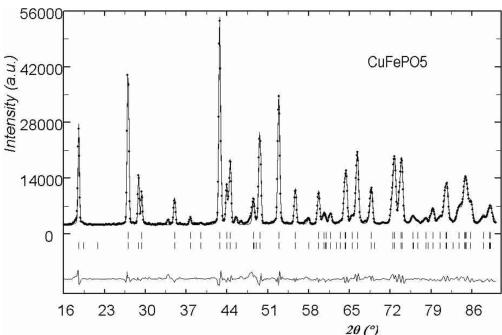
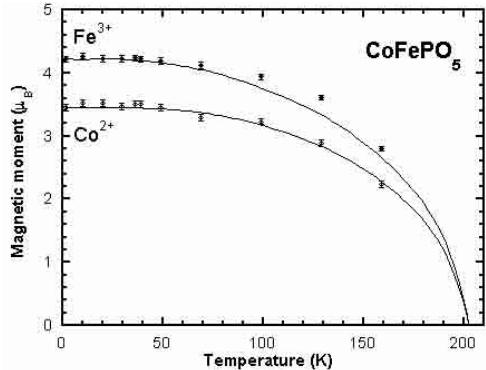
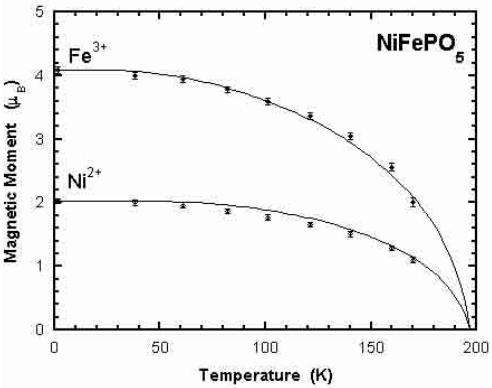
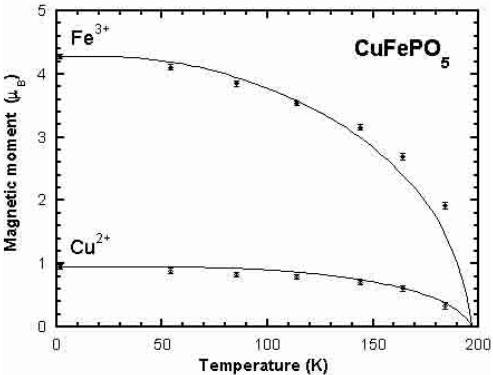
Below 176 K for \( CoFePO_{5} \) , 190 K for \( NiFePO_{5} \) and 204 K for \( CuFePO_{5} \) the neutron powder diffraction patterns present some new peaks and a higher intensity for some other peaks already present. These new contributions are attributed to magnetic ordering that have been confirmed by subsequent data analysis. In Figure 3 a 3D representation of the powder diffraction patterns as a function of temperature is shown. In all cases the magnetic reflections can be indexed in the same orthorhombic cell (a, b, c) as the nuclear reflections, so the magnetic ordering should be described by the propagation vector \( \mathbf{k} = (0, 0, 0) \) . For M = Ni/Cu, the magnetic reflections \( (h00) \) and \( (00l) \) are observed only when h or l are odd and the reflections \( (0k0) \) are not observed. In the case of M = Co the reflections \( (00l) \) are not observed at all. The magnetic atoms in the crystallographic lattice are M (Co, Ni or Cu) and Fe. Their positions correspond to 4a and 4c Wyckoff sites in the unit cell of the space group Pnma. The particular sequence we have used for numbering all magnetic atoms in the unit cell is described in Table 4. The magnetic structure was solved by testing the different basis functions of the irreducible representations of Pnma group for \( \mathbf{k} = (0, 0, 0) \) as given by Bertaut [14]. In the case of Ni and Cu compounds, the best agreement was obtained for a magnetic structure that can be described by the irreducible representation \( \Gamma_{1} \) with basis functions: \( [A_{x}, G_{y}, C_{z}] \) for the site 4a and \( [0, G_{y}^{\prime}, 0] \) for position 4c. The symbols \( A(+-+-) \) , \( C(++--) \) , \( F(++++) \) , \( G(+-+-) \) correspond to Bertaut's [14] notations. The structure is very well refined by using the collinear model \( [0, G_{y}, 0] \) \( [0, G_{y}^{\prime}, 0] \) , see the observed vs. calculated pattern for the Cu-compound in Figure 4a. The magnetic R-factor was 6.91% for Cu and 5.03% for Ni compounds, respectively. The resulting magnetic structure is identical to that previously found in \( \alpha \) -Fe \( _{2} \) PO \( _{5} \) [3].
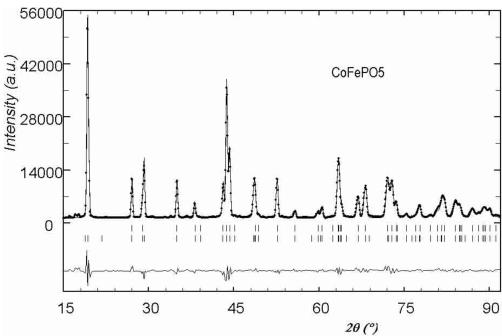
In the case of the Co compound the magnetic structure is best described by the irreducible representation \( \varGamma_{2} \) with basis functions: \( [F_{x}, C_{y}, G_{z}] \) for the site 4a and \( [F_{x}^{\prime}, 0, G_{z}^{\prime}] \) for position 4c. The experimental results from neutron diffraction agree very well with a planar model described by the basis functions: \( [0, C_{y}, G_{z}] \) for the site 4a and \( \left[0, 0, G_{z}^{\prime}\right] \) . The magnetic R-factor was 6.10%. We know, however, that a weak ferromagnetic component exists because it is clearly measured in macroscopic sus-


Fig. 3. Thermal variation of the neutron powder diffraction patterns of MFePO \( _{5} \) for Co, Ni and Cu samples; (G4-1, \( \lambda \approx 2.43 \) Å) for temperatures belonging to the intervals [1.4 K, 219 K], [1.5 K, 219 K] and [1.4 K, 224 K], respectively.
Table 4. MFePO_{5} (M = Co, Ni and Cu): atomic positions of magnetic ions in unit cell and their magnetic moments ( \( \mu_{B} \) ) at low temperature (position parameters x and z for Fe are given on Tab. 1).
| Element | Atomic position | CoFePO5 at 1.4K | NiFePO5 at 1.5 K | CuFePO5 at 1.4K | ||||||||
| Magnetic moments (μB) | ||||||||||||
| x/a | y/b | z/c | Mx | My | Mz | Mx | My | Mz | Mx | My | Mx | |
| M(1) | 0 | 0 | 0 | 0 | -0.77 (9) | 3.36 (5) | 0 | 2.03 (4) | 0 | 0 | 0.95 (4) | 0 |
| M(2) | ½ | 0 | ½ | 0 | -0.77 (9) | -3.36 (5) | 0 | -2.03 (4) | 0 | 0 | -0.95 (4) | 0 |
| M(3) | 0 | ½ | 0 | 0 | 0.77 (9) | 3.36 (5) | 0 | -2.03 (4) | 0 | 0 | 0.95 (4) | 0 |
| M(4) | ½ | ½ | ½ | 0 | 0.77 (9) | -3.36 (5) | 0 | -2.03 (4) | ||||
| Fe(1) | x | ¼ | z | 0 | 0 | 4.22 (5) | 0 | 4.09 (4) | 0 | 0 | 4.28 (4) | 0 |
| Fe(2) | ½ - x | ¾ | ½ + z | 0 | 0 | -4.22 (5) | 0 | -4.09 (4) | 0 | 0 | -4.28 (4) | 0 |
| Fe(3) | 1 - x | ¾ | 1 - z | 0 | 0 | 4.22 (5) | 0 | -4.09 (4) | 0 | 0 | -4.28 (4) | 0 |
| Fe(4) | ½ + x | ¼ | ½ - z | 0 | 0 | -4.22 (5) | 0 | -4.09 (4) | ||||

(a)

(b)
Fig. 4. Observed (circles) versus calculated (continuous line) neutron powder diffraction patterns for \( CuFePO_{5} \) (a) and \( CoFePO_{5} \) (b) compounds at 1.4 K. Nuclear (first row) and magnetic (second row) reflections positions are represented by vertical bars.

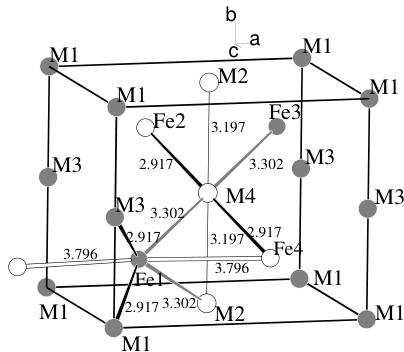
Fig. 5. Scheme of the magnetic structure of the MFePO \( _{5} \) compounds. Shaded and open circles represent opposite directions of the magnetic moments. For the Fe, Ni and Cu compounds the magnetic moments are all parallel to the b axis. For the Co compound (slightly non collinear) the main component of the magnetic moments are along the c axis (see text). The distance between magnetic atoms correspond to the exchange paths described in Table 5.
ceptibility data [8]. This component should be along the a-axis as suggested by the symmetry analysis but the component is too weak to be obtained from neutron powder diffraction. In Figure 4b the observed vs. calculated pattern is displayed. The additional non-indexed small peaks correspond to the magnetic ordering of the unknown impurities invoked above. A scheme of the magnetic structures is shown in Figure 5.
The magnetic moments obtained for Cu and Ni at low temperature correspond quite well to what is expected from the electronic configurations of the free ions. \( Cu^{2+} \) has a configuration \( t_{2g}^{6}e^{3}g \) , so a single unpaired electron occupies one of the \( d_{z^{2}} \) or \( d_{x^{2}-y^{2}} \) orbitals contributing as \( 1\mu_{B} \) compared to \( 0.95(4)\mu_{B} \) . For \( Ni^{2+} \) in a high spin
state \( (t_{2g}^{6}e_{g}^{2}) \) two unpaired electrons contribute as \( 2\;\mu_{B} \) compared to \( 2.03(4)\;\mu_{B} \) . For \( Fe^{3+} \) in the high spin configuration it is expected to get \( 5\;\mu_{B} \) , but we observed only \( 4.22(5)\;\mu_{B} \) , \( 4.09(5)\;\mu_{B} \) and \( 4.28(4)\;\mu_{B} \) for the Co, Ni and Cu compounds, respectively. This is probably due to a strong covalent character of the Fe-O bonds in these compounds.
The case of \( Co^{2+} \) deserves a special comment, it is well known that this ion in high spin state presents a relatively strong spin-orbit coupling that makes the total orbital angular momentum contributing to the magnetic moment. This is the reason why the observed magnetic moment for \( Co^{2+} \) 3.45(5) \( \mu_{B} \) is higher than what is expected on the basis of the spin-only value (3 \( \mu_{B} \) ). This is also the physical origin of the strong single ion anisotropy shown by \( Co^{2+} \) in many oxides. This particular anisotropy gives also the explanation of the different magnetic structure observed for the case of \( CoFePO_{5} \) as compared with the other compounds. Touaiher [8] has shown using EPR measurements, that \( Co^{2+} \) ions in \( CoFePO_{5} \) show a strong anisotropy of the g-tensor ( \( g_{\parallel} = 6.42 \) and \( g_{\perp} = 1.43 \) ) due to the strong spin-orbit coupling and the octahedral distortion. It should be borne in mind that, in spite of a different representation describing the magnetic structure of \( CoFePO_{5} \) , if we consider the main component of the moments the sequence of signs \( G = (+ - +; + - + -) \) is the same for all compounds, so the relative values of the isotropic exchange interactions should be similar.
The analysis of the diffraction patterns as a function of temperature shows that there is no change in the spin configuration in the whole temperature range of the ordered state. In Figure 6 we have represented the evolution of the magnetic moments as a function of temperature and the Brillouin curves fitting approximately the experimental data. The value of the transition temperatures obtained by fitting the data are \( T_{N} = 202(5) \) , 197(5) and 197(5) K for the Co, Ni and Cu compounds respectively. These values are manifestly too high, specially for \( CoFePO_{5} \) , if we consider \( T_{N} \) as the temperature at which long range order is established as seen in magnetic Bragg reflections (see Tab. 3). However, short range ordering appears at temperatures even slightly higher than those obtained from Brillouin curves. This is clearly seen as a bump of strong diffuse magnetic scattering around the position of the first magnetic reflection appearing at lower temperatures. See the region around reflection (100) in the diffraction patterns at higher temperatures shown in Figure 3. The disagreement of the Néel temperatures obtained from the Brillouin curves and the experimental \( T_{N} \) shows the inadequacy of the mean field approximation in the present case. The analysis of the diffuse scattering is out of the scope of this paper.
5 Analysis and discussion of the magnetic structures. Magnetic phase diagram
We shall try to precise the relative ranges of the exchange interactions within this type of crystal structure that give


Fig. 6. Amplitudes of the magnetic moments of the different ions in each compound as determined from the magnetic structure refinements. The continuous curve correspond to the self-consistent solutions of Brillouin functions for each spin value and local spontaneous magnetisation. The saturated moments have been set to the experimental value and the \( T_{N} \) adjusted in order to get the best fit to the experimental curves.
Table 5. Effective exchange interactions considered between transition metals within a distance of 4 Å range in \( MFePO_{5} \) (M = Fe, Co, Ni or Cu) compounds. Exchange paths, bond lengths and oxygen angles corresponding to each integral.
| Compound | J1 : M-Fe | J2 : M(x,y,z)-M(x,y+%z) | J3 : M-Fe | J4 : Fe(x,y,z) - Fe(%+x,y,-%z) | |
| Description | MO6 and FeO6 : share octahedra face. | MO6 and M'O6 : share an edge within a same chain. | MO6 et FeO6 : share one O2-ion. | FeO6 et Fe'O6 : bonded to a common oxygen. The two Fe3+ belong to two different chains. | |
| α-Fe2PO6 [2] | Distance M-M' (Å) | 2.9139 | 3.2160 | 3.3950 | 3.7239 |
| Exchange path M-O-M' : Distances M-O, O-M' (Å) | M-O1-Fe : 2.05; 2.15 ; 87.8° | M-O1-M' : 2.05; 2.05; 103.1° | M-O1-Fe : 2.05; 1.90; 118.4° | Fe-O1-Fe : 2.15; 1.90; 133.7° | |
| – angle M-O-M' | M-O2-Fe : 2.23 ; 2.21 ; 82.0° | M-O2-M' : 2.23 ; 2.23 ; 92.3° | |||
| M-O4-Fe : 2.12 ; 2.02 ; 89.6° | |||||
| CoFePO6 | Distance M-M' (Å) | 2.9011 | 3.2234 | 3.3952 | 3.6729 |
| Distances M-O, O-M' (Å) | M-O1-Fc : 2.08 ; 2.10 ; 88.0° | M-O1-M' : 2.08; 2.08; 101.7° | M-O1-Fc : 2.08; 1.88; 118.1° | Fe-O1-Fc : 2.10; 1.88; 134.9° | |
| – angle M-O-M' | M-2-Fc : 2.19 ; 2.30 ; 80.4° | M-2-O-M' : 2.1 ; 2.19 ; 94.9° | |||
| M-O4-Fc : 2.07 ; 2.02 ; 90.4° | |||||
| NiFePO6 | Distance M-M' (Å) | 2.9028 | 3.1962 | 3.3913 | 3.6502 |
| Distances M-O, O-M' (Å | M-O1-Fe : 2.07 ; 2.08 ; 88.9° | M-O1-M' : 2.07; 2.07; 101.2° | M-O1-Fc : 2.07; 1.89; 118.0° | Fe-O1-Fc : 2.08; 1.89; 134.0° | |
| – angle M-O-M' | M-M' : 2.13 ; 2.41 ; 79.3° | M-O2-M' : 2.13 ; 2.13 ; 97.2° | |||
| M-O4-Fc :2.04 ; 2.01 ; 91.6° | |||||
| CuFePO6 | Distance M-M' (Å) | 2.9167 | 3.1974 | 3.3024 | 3.7963 |
| Distances M-O, O-M' (Å, | M-O1-Fc : 1.97 ; 2.27 ; 86.7° | M-O1-M' : 1.97; 1.97; 108.5° | M-O1-Fc : 1.97 ; 1.88; 118.0° | Fe-O1-Fc : 2.27; 1.88; 132.2° | |
| – angle M-O-M' | M-Pc : 2.36 ; 2.09 ; 81.8° | M-O2-M' : 2.36 ; 2.36 ; 85.4° | |||
| M-O4-Fc :200 ; 2.02 ; 93.0° |
rise to the observed magnetic structure, considered without reference to the anisotropy forces that merely orient the spins with respect to the crystal lattice. Our analysis will neglect the possible competition between exchange and anisotropy that may play a minor role in the case of the Co compound giving rise to the observed slightly non-collinear structure. The complexity of the topology is such that we had to treat the problem numerically using two computer programs, SIMBO and ENERMAG, that are shortly described in the Appendix.
In Table 5 we give the list of the effective exchange interactions that should be considered to study the problem. This table is provided by the topological analysis performed by SIMBO. We have considered a maximum distance of 4 Å, which means all the longer range interactions are neglected. Above 4 Å there is a gap in cation-cation distances, the first neglected interaction is between Fe and Fe at a distance at least of 4.92 Å. We have verified that the four exchange interactions below an interaction distance of 4 Å are needed to describe the system. In fact only three exchange interactions are needed to justify the observed magnetic structure, however the two interactions connecting ions of adjacent chains may be of similar strength and we decided to consider all the exchange interactions up to 4 Å. Let us describe the exchange paths associated to these interactions and the prediction of the signs following the Goodenough-Kanamori-Anderson rules (GKAR) [4–6]. We shall use average values over the four compounds for the geometrical characteristics (distances and angles) in the forthcoming description of exchange paths. The number in parenthesis corresponds to the standard deviation of the average between the different values and refers to the last significant digit.
The exchange interaction \( J_{1} \) corresponds to the total exchange between \( M^{2+} \) and \( Fe^{3+} \) nearest neighbours. The average distance is 2.91(1) Å. The \( M^{2+}O_{6} \) and \( Fe^{3+}O_{6} \) octahedra share a face, the \( M^{2+}-Fe^{3+} \) distances are listed in Tables 2, 5, so that the magnetic ions are connected by a triple superexchange path with average \( M^{2+}-O-Fe^{3+} \) angles of 88(2), 81(2) and 91(2) degrees. As the cations are in octahedra sharing a face a direct exchange is in principle possible, however the much too long \( M^{2+}-Fe^{3+} \) distance allows us to discard this (negative, antiferromagnetic) term in the total interaction. The GKAR predict for all kind of \( M^{2+} \) cations considered here a positive value, so ferromagnetic, for this exchange interaction.
The exchange interaction \( J_{2} \) corresponds to the total exchange between two \( M^{2+} \) cations through a double oxygen bridge. The average \( M^{2+}-M^{2+} \) distance is 3.21(2) Å. The two \( M^{2+}-O-M^{2+} \) angles have as average values 104(5) and 92(7) degrees. The GKAR predict for all kind of \( M^{2+} \) cations considerer here also a ferromagnetic interaction ( \( J_{2} > 0 \) ).
The exchange interaction \( J_{3} \) corresponds to the total exchange between next nearest neighbours \( M^{2+} \) and \( Fe^{3+} \) cations through a single oxygen bridge. This exchange interaction connects two adjacent chains. The average \( M^{2+}-Fe^{3+} \) distance is 3.36(7) Å and the average \( M^{2+}-O(1)-Fe^{3+} \) angle is 118(1) degrees. This angle is nearly constant over the four compounds (see Tab. 6). The GKAR cannot predict, unambiguously, the sign of the exchange interaction \( J_{3} \) .
Table 6. Angles, in degrees, around oxygen and phosphorus atoms (X-O-X' (X, X' = M^{2+} or Fe^{3+}) and O-P-O) in MFePO_{5} (M = Fe, Co, Ni or Cu) compounds.
| Angle | Fe_{2}PO_{5} [2] | CoFePO_{5} | NiFePO_{5} | CuFePO_{5} | Average (°) |
| M-O1-M' | 102.8 (2) | 101.7 (1) | 101.2 (1) | 108.5 (1) | 104 (5) |
| M-O1-Fe | 118.7 (3) | 118.1 (1) | 118.0 (2) | 118.0 (1) | 118.2 (5) |
| M-O1-Fe | 87.4 (2) | 88.0 (1) | 88.9 (2) | 86.7 (1) | 88 (2) |
| Fe-O1-Fe' | 133.8 (2) | 134.9 (1) | 134.0 (2) | 132.1 (2) | 134 (2) |
| M-O2-M' | 92.1 (2) | 94.9 (1) | 97.2 (1) | 85.4 (1) | 92 (7) |
| M-O2-Fe | 81.9 (3) | 80.4 (1) | 79.3 (1) | 81.8 (1) | 81 (2) |
| M-O2-P | 124.4 (3) | 125.4 (2) | 126.2 (3) | 124.5 (2) | 125 (2) |
| Fe-O3-P | 145.6 (3) | 145.7 (2) | 147.3 (4) | 143.8 (3) | 146 (2) |
| M1-O4-Fe3 | 89.5 (1) | 90.4 (1) | 91.6 (1) | 93.0 (1) | 91 (2) |
| M1-O4-P | 130.0 (2) | 130.4 (1) | 130.3 (3) | 128.8 (2) | 130 (2) |
| Fe-O4-P | 134.8 (2) | 133.2 (1) | 131.7 (1) | 133.7 (1) | 133 (2) |
| O2-P-O3 | 111.2 (5) | 111.1 (2) | 110.6 (4) | 112.3 (3) | 111 (2) |
| O2-P-O4 | 108.6 (5) | 108.6 (2) | 108.6 (3) | 108.7 (3) | 108.6 (1) |
| O3-P-O4 | 111.0 (3) | 110.8 (2) | 110.7 (3) | 110.2 (2) | 110.7 (5) |
| O4-P-O4 | 106.3 (3) | 106.6 (1) | 107.6 (2) | 106.5 (2) | 106.7 (9) |
The exchange interaction \( J_{4} \) corresponds to the exchange between nearest neighbours \( Fe^{3+} \) cations through a single oxygen bridge. The two \( Fe^{3+} \) cations belong to adjacent chains and are connected by O(1). The average \( Fe^{3+}-Fe^{3+} \) distance is 3.71(9) Å and the average \( Fe^{3+}-O(1)-Fe^{3+} \) angle is 134(2) degrees. The GKAR indicate that the sign of the exchange interaction \( J_{4} \) should be, with great probability, negative for all compounds. This exchange should be, in principle, responsible for the overall antiferromagnetic behaviour of these compounds, and may be the strongest in absolute value.
In the discussion about the magnetic properties and the magnetic structure of \( \alpha-Fe_{2}PO_{5} \) , Warner et al. [3] consider that the most important exchange interactions are ferromagnetic and act through the paths M-O(4)-Fe \( (J_{1}) \) and M-O(1)-M \( (J_{2}) \) . They base their argument on the fact that the corresponding M-M and M-Fe distances are shorter than for the other exchange paths. These authors do not explain what are the conditions that the exchange interactions have to satisfy in order to explain the observed magnetic structure. The negative value of the paramagnetic Curie temperature for all compounds (see Tab. 3) indicates predominant antiferromagnetic interactions that is in contradiction with the hypothesis of Warner et al. [3].
We shall try to evaluate the problem of the relative strength of the exchange interactions using the numerical phase diagram generated by the program ENERMAG (see Appendix).
The problem of the magnetic ground state of a system of classical spins connected by isotropic exchange interactions was considered 40 years ago by several authors \( [15–18] \) . Yoshimori \( [15] \) and Vilain \( [16] \) treated the case of a Bravais lattice and Lyons and Kaplan \( [17] \) extended the procedure to the case of a general crystal structure with more than one magnetic atom per primitive cell. Here we follow the discussion summarised in the paper of Freiser \( [18] \) . The first ordered state can be obtained from the resolution of an eigenvalue problem where the matrix is the Fourier transform of the exchange interactions. In our case we have no magnetic phase transition below \( T_{N} \) , so the first ordered state, the magnetic just below the Néel temperature, is the ground state \( [18] \) . We will use then the method discussed in the Appendix to evaluate the conditions satisfied by the exchange integrals in order to have the propagation vector \( \mathbf{k} = (0, 0, 0) \) and the observed spin arrangement, \( G = (+\cdots; +\cdots) \) , as the ground state.
In the crystal structure of the compounds MFePO_{5} we have a total of eight magnetic atoms of two chemical species (Fe^{3+} S = 5/2 and either Fe^{2+} S = 2, Co^{2+} S = 3/2, Ni^{2+} S = 1 or Cu^{2+} S = 1/2) per primitive cell, so the matrix of the Fourier transform of isotropic exchange interactions is an \( 8 \times 8 \) hermitian matrix (see Eq. (A.1)). Considering the isotropic exchange interactions up to a distance of 4 Å, as given in Table 5, the terms of the matrix, provided by the program SIMBO, are those given in Table 7.
The energy, lowest eigenvalue of the matrix \( \xi(\mathbf{k},\{J_{ij}\}) \) , as a function of the exchange integrals and \( \mathbf{k}=(X,Y,Z) \) can be obtained only numerically. The vector k minimizing \( \lambda(\mathbf{k},\{J_{ij}\}) \) for a given set of \( \{J_{ij}\} \) is the propagation vector of the magnetic structure and the spin configuration is obtained from the corresponding eigenvector [15–18]. For the cases in which \( k=1/2H \) , being H a reciprocal lattice vector, including \( \mathbf{H}=(0,0,0) \) , the eigenvectors are all real.
Table 7. Exchange matrix of \( MFePO_{5} \) compounds. The unit cell contains eight magnetic atoms. Exchange interactions are supposed effective within 4 Å range. \( J_{1} \) , \( J_{2} \) , \( J_{3} \) and \( J_{4} \) are exchange interactions. X, Y and Z stand for the components of the k-vector within the Brillouin Zone.
| M1 | M2 | M3 | M4 | Fe1 | Fe2 | Fe3 | Fe4 | |
| M1 | 0 | 0 | J2(1+e2πi(Y)) | 0 | J1e2πi(Z) | J3e2πi(X+Z) | J1e2πi(X+Y) | J3e2πi(Y) |
| M2 | 0 | 0 | 0 | J2(1+e2πi(Y)) | J3 | J1 | J3 | J1 |
| M3 | J2(1+e-2πi(Y)) | 0 | 0 | 0 | ||||
| M4 | 0 | J2(1+e2πi(Y)) | 0 | 0 | J1e2πi(Z) | J3e2πi(Y+Z) | J1e2πi(X) | J3 |
| Fe1 | J1e-2πi(Z) | J3 | J1e-2πi(Z) | J3 | J1 | J3e2πi(Y) | J1e2πi(Y) | |
| Fe2 | J3e-2πi(X+Z) | J1 | J3e-2πi(X+Z) | J1 | 0 | J4(1+e2πi(X)) | 0 | 0 |
| Fe3 | J1e-2πi(X+Y) | J3 | J1e-2πi(X) | J3e-2πi(Y) | 0 | 0 | 0 | 0 |
| Fe4 | J3e-2πi(Y) | J1 | J3 | J1e-2πi(Y) | 0 | 0 | 0 | 0 (J4(1+e2πi(X)) |
Table 8. Label of the magnetic structures and sign sequences of the magnetic moments corresponding to atoms \( M_{1} \) , \( M_{2} \) , \( M_{3} \) , \( M_{4} \) , \( Fe_{1} \) , \( Fe_{2} \) , \( Fe_{3} \) and \( Fe_{4} \) characterising the four possible collinear magnetic structures for k = 0. The subscripts correspond to the atomic positions given in Table 4. We have numbered as 5 the incommensurate or disordered magnetic structures occurring in the magnetic phase diagram due to frustration effects.
| Sign sequences of collinear magnetic moments | ||||||||
| \( \mathbf{M}_{\mathbf{M1}} \) | \( \mathbf{M}_{\mathbf{M2}} \) | \( \mathbf{M}_{\mathbf{M3}} \) | \( \mathbf{M}_{\mathbf{M4}} \) | \( \mathbf{M}_{\mathbf{Fe1}} \) | \( \mathbf{M}_{\mathbf{Fe2}} \) | \( \mathbf{M}_{\mathbf{Fe3}} \) | \( \mathbf{M}_{\mathbf{Fe4}} \) | |
| 1 : k=(0,0,0) | + | - | + | - | - | + | - | + |
| 2 : k=(0,0,0) | + | + | + | + | + | + | + | + |
| 3 : k=(0,0,0) | + | - | + | - | + | - | + | |
| 4 : k=(0,0,0) | + | + | + | |||||
| 5 : | Case of disordered or incommensurate structures | |||||||
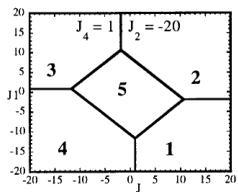
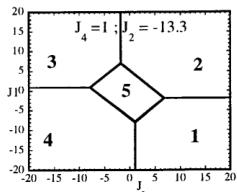
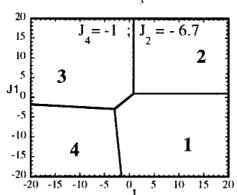
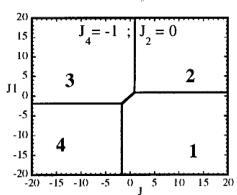
and the sequence of signs of the eigenvector components corresponding to the lowest eigenvalue, gives the spin configuration corresponding to the first ordered state (the ground state in our particular case). To study the problem with ENERMAG we have varied the values of all the exchange interactions \( J_{i}(i = 1, 2, 3) \) taking \( J_{4} \) as a reference value ( \( J_{4} = 1 \) or \( J_{4} = -1 \) ) in the interval [-20, 20] and the k-vectors inside, and in special points, of the Brillouin zone (BZ). Taking a broader range for the exchange interactions does not change qualitatively the results. One can deduce, by continuity, the shape of the phase diagram for regions outside the used range in the numerical calculations. All exchange interactions are then effectively measured in units of \( |J_{4}| \) . An auxiliary program takes the output of ENERMAG and plots a high dimensional phase diagram using the exchange interactions as Cartesian axes. The different regions correspond to different magnetic structures. We have numbered the four kinds of collinear magnetic structures, in the \( \Gamma \) -point of the BZ \( \mathbf{k} = (0, 0, 0) \) , found by the program and numbered as “5” the regions where either there is no classical magnetic order (degeneracy of the magnetic energy with respect to the value of k) or the magnetic structure is incommensurate due to strong frustrations effects. In Table 8 it is represented the sign sequence characterising the four collinear structures. The actual magnetic structure of the compounds \( MFePO_{5} \) is given by the sequence \( G = (++-+-+--) \) and it is numbered as “3”.
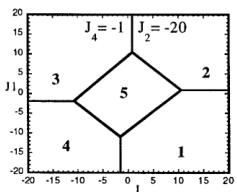
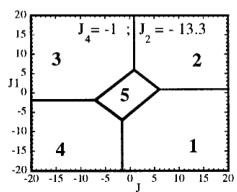
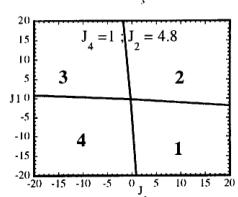
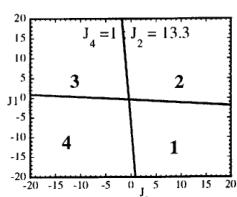
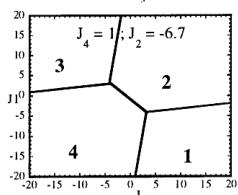
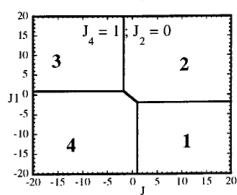
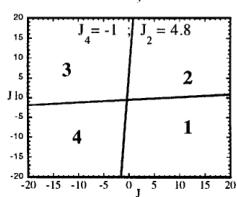
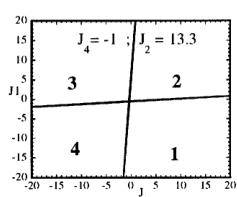
In Figure 7 we have represented 2D maps of the different regions for representative cases. An analysis of the boundaries between the regions gives us the conditions that have to satisfy the exchange integrals to give, as the first ordered state, the observed magnetic structure. For the two cases \( (J_{4} = \pm1) \) the same regions coexist in the phase diagram, see Figure 7. If we consider cuts along the \( J_{2} \) axis the domains in J-space may be classified into three regions:
-
In the first region \( (J_{2} < -7.4 \mid J_{4}) \) the five types of structure coexist. The domain 5 has a parallelogram shape in \( J_{1}-J_{3} \) plane and its surface diminish with the strength of \( J_{2} \) .
-
For values of \( J_{2} \geq -7.4 \mid J_{4} \mid (J_{4} = \pm 1) \) the domain 5 disappears. In the second region, the domain 5 is replaced by a plane boundary between the domains 1


(a)


(b)

Fig. 7. Magnetic phase diagram for \( J_{4} = -1 \) (a) and for \( J_{4} = +1 \) (b). Phases numbered 1, 2, 3, and 4 correspond to \( \mathbf{k} = (0, 0, 0) \) collinear magnetic structures found by the program ENERMAG. The sequence of signs is described in Table 8. The label 5 corresponds to incommensurate or disordered structures.
and 3 (for \( J_{4} = -1 \) ) or between domains 2 and 4 (for \( J_{4} = +1 \) ). The segment corresponding to the intersection of this boundary with the \( J_{1}-J_{3} \) plane diminish in length up to the point in which \( J_{2} = 4.29 \left| J_{4} \right| (J_{4} = \pm 1) \) .
- For \( J_{2} \geq 4.29 |J_{4}| \) the four magnetic collinear phases occupy the whole J-space independently of the particular value of \( J_{2} \) .
The first region, where the domain 5 exist, appears only for the case of strong negative \( J_{2} \) interaction. This is due to the frustration effects that may be easily understood because the triangular arrangement of the magnetic ions in the chains. This is unlikely to be observed in real structures of this topology with transition metals due to the expected positive sign of the two exchange integrals \( J_{1} \) and \( J_{2} \) . In fact an effective intra-chain interaction has been obtained for the case of \( \alpha-Fe_{2}PO_{5} \) [13] that is positive with a value \( J = 1/3(2J_{1} + J_{2}) = 32.51 \, cm^{-1} \) , however the model hypothesis (isolated chains) used by these authors to interpret their susceptibility data may be wrong. If we take into account the GKAR and assume that both exchange interactions \( J_{1} \) and \( J_{2} \) are positive, as in \( \alpha-Fe_{2}PO_{5} \) , we can establish the conditions to be satisfied by the exchange integrals in order to observe the domain 3, i.e. the experimental magnetic structure. The conditions are either one of the following:
i) \( J_{1} > 0, J_{2} > 0 \) and \( J_{3} \leq 1.4 |J_{4}| \) for \( J_{4} = -1 \)
ii) \( J_{1} > 0.4 |J_{4}|, J_{2} > 0 \) and
\[ J_{3}<-0.4\left|J_{4}\right|\quad for\quad J_{4}=+1. \]
The exchange interactions responsible for the observed magnetic structure are then \( J_{3} \) and \( J_{4} \) . As discussed above, the superexchange path (the \( Fe^{3+}-O-Fe^{3+} \) angle is around 134 degrees) related to \( J_{4} \) suggests a weak negative interaction, so that the condition i) holds. This means that \( J_{3} \) may also be positive but weaker than \( 1.4|J_{4}| \) . This is quite plausible due to a superexchange angle (the \( M^{2+}-O-Fe^{3+} \) angle is 118.0 degrees) closer to 90 degrees.
6 Remarks and conclusions
We have studied and refined the crystal and magnetic structures of the oxyphosphate family MFePO_{5} (M = Co, Ni, Cu). We have confirmed the isomorphism of the whole
family with the \( \alpha-Fe_{2}PO_{5} \) phase and no disorder exists between the transition metal sublattices. The experimental results show that these compounds are antiferromagnetic insulators. The effective antiferromagnetic order is achieved only by antiferromagnetic interactions between zigzag alternating chains. An analysis of the magnetic topology shows that a region without long range magnetic order (or complex incommensurate ordering) could be obtained if the exchange integrals within the chains were of opposite sign, due to the zigzag nature (corner sharing alternating triangles) of the chains. The numerical phase diagram has allowed us to establish the relative stability regions of collinear magnetic structures for different values of the exchange interactions.
We thank Dr E. Chemseddine from Laboratoire de Chimie Physique, Faculté des Sciences El Jadida, Morocco, for preparing a first set of samples and for helpful discussions concerning the preparation of the powdered samples we used in this study. The research has been supported by CEA-DRI, CNESTEN and COPEP organisms.
Appendix
The program SIMBO analyses the crystal structure of an insulator in terms of super-exchange \( M_{1}-X-M_{2} \) and super-super-exchange \( M_{1}-X_{1}-X_{2}-M_{2} \) paths. It needs as input the list of atom co-ordinates in the asymmetric unit, as well as their ionic charge and the saturation magnetic moment, the space group symbol and the cell parameters. The program will use this information to calculate distance, angles and exchange paths. The user may introduce some constraints concerning the geometry of the required exchange paths in order to limit and eliminate loops of involved shapes.
The program produces as output a list of paths of both types and attributes symbols for the different exchange interactions that are also classified as a function of the interatomic distances. Another output is a formal description of the Fourier transform of the isotropic exchange interactions in form of a \( n \times n \) matrix, where n is the number of magnetic ions in a primitive unit cell (see below). This information is summarised in a file that serves as input for the program ENERMAG.
The first ordered state is obtained, as a function of k (on the surface or at the interior of the BZ) and the exchange integrals, as the eigenvector corresponding to the lowest eigenvalue of the negative Fourier transform of exchange integral matrix \( [15-18] \) :
\[ \xi_{i j}(\mathbf{k})=-\sum_{m}J_{i j}(\mathbf{R}_{m})\exp\{-2\pi\mathbf{i}\mathbf{k}\mathbf{R}_{m}\}. \quad (A.1) \]
The indices i, j refer to the magnetic atoms in a primitive cell, \( J_{ij}(\mathbf{R}_{m}) \) is the isotropic exchange interaction between the spins of atoms i and j in unit cells separated by the lattice vector \( R_{m} \) . We have adopted the interaction energy between two spins as
\[ W=-\mathcal{J}_{i j}\mathbf{S}_{i}\mathbf{S}_{j}=-\mathcal{J}_{i j}S_{i}S_{j}\mathbf{s}_{i}\mathbf{s}_{j}=-J_{i j}\mathbf{s}_{i}\mathbf{s}_{j}, \quad (A.2) \]
so \( J_{ij}(\mathbf{R}_{m}) \) includes the spin modules and \( s_{i} \) is a unit vector. This is not the same convention as that of Freiser [18] where the minus sign is not given. Our convention agrees with the common use of negative \( J' \) s for anti-ferromagnetic coupling.
The program ENERMAG handles the diagonalisation of the matrix (A.1) that is provided by the output file coming from SIMBO. It solves, then, the parametric equation:
\[ \xi(\mathbf{k},\mathbf{J})\mathbf{v}(\mathbf{k},\mathbf{J})=\lambda(\mathbf{k},\mathbf{J})\mathbf{v}(\mathbf{k},\mathbf{J}) \quad (A.3) \]
where J stands for the set of exchange interactions \( \{J_{ij}\} \) , and k is a vector in the asymmetric unit of the BZ. For a given set J, and no degeneracy, the lowest eigenvalue \( \lambda_{\min}(\mathbf{k}_{0}, \mathbf{J}) \) occurs for a particular \( k_{0} \) . The corresponding eigenvector \( \mathbf{v}_{\min}(\mathbf{k}_{0}, \mathbf{J}) \) (that may be complex for incommensurate structures), describes the spin configuration of the first ordered state [15–18]. The user can give the value of the exchange interaction and study the magnetic energy as a function of k in the BZ using lines, planes or the whole BZ including special points. Another way of working with ENERMAG is the generation of “magnetic phase diagrams” as a function of the exchange parameters. The program explores, for each point in the J-space, the asymmetric unit of the BZ and detects the value of \( k = k_{0} \) for which the energy is minimum and equal to \( \lambda_{\min}(\mathbf{k}_{0}, \mathbf{J}) \) . The eigenvector \( \mathbf{v}_{\min}(\mathbf{k}_{0}, \mathbf{J})} \) gives the Fourier coefficients of the magnetic structure as a function of the exchange parameters J. See references [15–18] for further details.
References
-
M. Imada, A. Fujimori, Y. Tokura, Rev. Mod. Phys. 70, 1039 (1998).
-
A. Modaressi, A. Courtois, R. Gerardin, B. Malaman, C. Gleitzer, J. Solid State Chem. 40, 301 (1981).
-
J.K. Warner, A.K. Cheetham, D.E. Cox, R. Von Dreele. J. Am. Chem. Soc. 114, 6074 (1992).
-
J.B. Goodenough, Magnetism and the Chemical Bond (Interscience Publishers 1963).
-
J. Kanamori, J. Phys. Chem. Solids 10, 87 (1959).
-
P.W. Anderson, Magnetism A Treatise on Modern Theory and Materials, Vol. 1 (Academic Press 1963), pp. 25–83.
-
M. Touaiher, A. El Hajbi, Physical Chemistry of Solid State Materials REMCES VI, Adv. Mater. Research, Vols. 1-2, pp. 215 (1994).
-
Mostapha Touaiher, Thèse de Diplôme d'Études Supérieures, Université Chouaïb Doukkali, Faculté des Sciences El Jadida (1995).
-
H.M. Rietveld, Acta Cryst. 22, 151 (1967); J. Appl. Cryst. 2, 65 (1969).
-
J. Rodríguez-Carvajal, Physica B 192, 55 (1993).
-
J. Rodríguez-Carvajal (unpublished).
-
I.D. Brown, Acta Cryst. B 48, 553 (1992).
-
E. Chemseddine, A. El Hajbi, Ann. Chim. Sci. Mat. 24, 241 (1999).
-
E.F. Bertaut, Acta Cryst. A 24, 217 (1968).
-
A. Yoshimori, J. Phys. Soc. Jpn 14, 807 (1959).
-
J. Villain, J. Phys. Chem. Solids 11, 303 (1959).
-
D.H. Lyons, T.A. Kaplan, Phys. Rev. 120, 1580 (1960).
-
M.J. Freiser, Phys. Rev. 123, 2003 (1961).
 p12_0.jpg
 p12_1.jpg
 p12_10.jpg
 p12_11.jpg
 p12_2.jpg
 p12_3.jpg
 p12_4.jpg
 p12_5.jpg
 p12_6.jpg
 p12_7.jpg
 p12_8.jpg
 p12_9.jpg
 p3_0.jpg
 p3_1.jpg
 p6_0.jpg
 p6_1.jpg
 p6_2.jpg
 p7_0.jpg
 p7_1.jpg
 p7_2.jpg
 p8_0.jpg
 p8_1.jpg
 p8_2.jpg