LaMnO3 (0.1)
Zero propagation vector| Transition Temperature | 139.5 K |
|---|---|
| Experiment Temperature | 1.4 K |
| Propagation Vector | k1 (0, 0, 0) |
| Parent Space Group | Pnma (#62) |
| Magnetic Space Group | Pn'ma' (#62.448) |
| Magnetic Point Group | m'm'm (8.4.27) |
| Lattice Parameters | 5.7461(2) 7.6637(4) 5.5333(2) 90.0000 90.0000 90.0000 |
|---|---|
| DOI | 10.1103/PhysRevB.54.15149 |
| Reference | âMoussa,, F.â, Hennion, M., Rodriguez-Carvajal, J., Moudden, H., Pinsard, L., Revcolevschi, A et al., PHYSICAL REVIEW B (1995) 54 15149 - 15155 |
| Label | Element | Mx | My | Mz | |M| |
|---|---|---|---|---|---|
| Mn | Mn | 3.87 | 0.0 | 0.0 | 3.87 |
Title
Spin waves in the antiferromagnet perovskite LaMnO \( _{3} \) : A neutron-scattering study
Authors
F. Moussa, M. Hennion, J. Rodriguez-Carvajal, and H. Moudden Laboratoire Léon Brillouin, Centre d'Etudes de Saclay, 91191 Gif-sur-Yvette Cedex, France
L. Pinsard and A. Revcolevschi Laboratoire de Chimie des Solides, Université Paris-Sud, 91405 Orsay Cedex, France
Materials Studied
\( LaMnO_{3} \) (undoped, orthorhombic phase)
Key Information
- Crystal structure / space group: Orthorhombic, \( Pbnm \)
- Magnetic ordering type and temperature: A-type antiferromagnetic. Ferromagnetic coupling within (a,b) planes, antiferromagnetic coupling along c.
- Néel temperature ( \( T_{N} \) ): \( 139.5 \pm 0.3 \) K
- Propagation vector(s): k=0 (commensurate)
- Magnetic moments:
- \( \mu_{Mn} = 3.87(3) \mu_{B} \) (aligned along the b-axis)
- Lattice parameters (at T=1.4 K):
- \( a=5.5333(2) \) Å
- \( b=5.7461(2) \) Å
- \( c=7.6637(4) \) Å
- Other critical measured values:
- Critical exponent of sublattice magnetization ( \( \beta \) ): 0.28
- Spin wave gap (at low temperature): 2.7 meV
- Spin of \( Mn^{3+} \) ions: S=2
- Exchange integrals:
- \( J_{1} = 0.2 \mathrm{~THz} \) (or \( 0.83 \mathrm{~meV} \)) \( \pm 0.01 \mathrm{~THz} \) (ferromagnetic, within a,b plane)
- \( J_{2} = -0.14 \mathrm{~THz} \) (or \( -0.58 \mathrm{~meV} \)) \( \pm 0.005 \mathrm{~THz} \) (antiferromagnetic, along c)
- Single ion anisotropy term: \( D = 0.04 \mathrm{~THz} \) (or \( 0.165 \mathrm{~meV} \)) \( \pm 0.002 \mathrm{~THz} \)
Synthesis Method
Single crystals of \( LaMnO_{3} \) (approx. \( 1\ cm^{3} \) with \( 0.6^{\circ} \) mosaic spread) were grown by a floating method using an image furnace. The starting powder was prepared by solid-state reaction of stoichiometric amounts of \( La_{2}O_{3} \) (fired in air at \( 900\ ^{\circ}C \) before use) and \( MnO_{2} \). The resulting powder was pressed into cylinders under a hydrostatic pressure of 2 kbar and sintered in air at \( 1150\ ^{\circ}C \). These cylinders served as feed and support rods in the floating zone experiments, which were carried out at a growth rate of 1 cm per hour. The procedure yielded nearly stoichiometric \( LaMnO_{3} \) with no detectable \( Mn^{4+} \) ions.
Abstract
As part of a general work on doped manganese perovskites, we have carried out detailed neutron-scattering experiments on powder and single crystals of the orthorhombic phase of undoped \( LaMnO_{3} \). The temperature dependence of the sublattice magnetization has been determined in the antiferromagnetic phase ( \( T_{N}=139.5~K \) ), and the critical exponent is \( \beta=0.28 \) , well below that corresponding to a pure three-dimensional Heisenberg antiferromagnet. We have measured the dispersion of the spin waves propagating in the highest symmetry directions solving the problems related to twinning. The whole spin wave spectrum is well accounted for with a Heisenberg Hamiltonian and a single ion anisotropy term responsible for the easy magnetization direction (b axis). This term induces a gap of 2.7 meV at low temperature in the spin wave dispersion curve. An important result is that the ferromagnetic exchange integral ( \( J_{1}\approx0.83~meV \) ), coupling the spins within the ferromagnetic basal plane (a,b), is larger by a factor 1.4 than the antiferromagnetic exchange integral ( \( J_{2}\approx-0.58~meV \) ) coupling spins belonging to adjacent \( MnO_{2} \) planes along c.
Main Content Summary
This study investigates the microscopic magnetic properties of undoped orthorhombic \( LaMnO_{3} \) using neutron scattering, motivated by the discovery of giant magnetoresistance in doped manganese perovskites. The paper highlights the complex structural and magnetic phase diagrams of these compounds and the importance of understanding the parent compound. \( LaMnO_{3} \) is characterized by \( Mn^{3+} \) ions with localized \( t_{2g}^{3}e_{g}^{1} \) electrons, leading to S=2 spins. Cooperative Jahn-Teller distortion induces orbital ordering, resulting in ferromagnetic coupling within the (a,b) basal plane and antiferromagnetic coupling along the c-axis, forming an A-type antiferromagnetic structure.
Experimental work involved neutron powder diffraction for structural and magnetic characterization, and elastic and inelastic neutron scattering on a single crystal. A significant challenge was the crystal twinning, which is common in perovskites. The authors identified three coexisting F-domains, causing a given path in reciprocal space to correspond to multiple distinct symmetry paths, thus measuring several dispersion curves simultaneously. This complexity was carefully analyzed to extract coherent results. The magnetic order parameter was determined from elastic scattering, revealing a Néel temperature \( T_{N}=139.5\pm0.3 \) K and a critical exponent \( \beta=0.28 \). This \( \beta \) value is lower than the 3D Heisenberg model prediction (0.36), which the authors attribute to a significant single-ion anisotropy.
Inelastic neutron scattering experiments successfully measured spin wave dispersion curves along the \( [100]^{*} \), \( [110]^{*} \), and \( [001]^{*} \) directions. A spin wave gap of 2.7 meV was observed at low temperatures, confirming the presence of a single-ion anisotropy term in the Hamiltonian, aligning spins along the b-axis. The dispersion relations were well-fitted using an anisotropic three-dimensional Heisenberg Hamiltonian with two exchange integrals: \( J_{1} \) for nearest neighbors in the (a,b) plane and \( J_{2} \) for nearest neighbors along c, plus the anisotropy term D. The determined values are \( J_{1} \approx 0.83 \) meV (ferromagnetic), \( J_{2} \approx -0.58 \) meV (antiferromagnetic), and \( D \approx 0.165 \) meV.
The signs of \( J_{1} \) and \( J_{2} \) are consistent with the observed A-type magnetic structure and qualitative predictions based on Goodenough-Kanamori rules, which are explained by the orbital ordering resulting from the cooperative Jahn-Teller effect. The ferromagnetic \( J_{1} \) arises from the antiferrodistorsive orbital ordering in the basal plane, while the antiferromagnetic \( J_{2} \) along c is due to the involvement of the same orbital in adjacent Mn-O-Mn bonds. The study provides crucial microscopic magnetic parameters for \( LaMnO_{3} \), serving as a baseline for understanding doped manganese perovskites.
Conclusion
In conclusion we have fully determined the magnetic interactions in \( LaMnO_{3} \) despite difficulties induced by the twinning of the crystal. A Heisenberg model with a single ion anisotropy accounts fairly well for the experimental results. The anisotropy and the sign of exchange integrals are in good agreement with both magnetic structure and the qualitative predictions based on Goodenough-Kanamori rules.
Spin waves in the antiferromagnet perovskite LaMnO \( _{3} \) : A neutron-scattering study
F. Moussa, M. Hennion, J. Rodriguez-Carvajal, and H. Moudden Laboratoire Léon Brillouin, Centre d'Etudes de Saclay, 91191 Gif-sur-Yvette Cedex, France
L. Pinsard and A. Revcolevschi Laboratoire de Chimie des Solides, Université Paris-Sud, 91405 Orsay Cedex, France (Received 17 May 1996)
As part of a general work on doped manganese perovskites, we have carried out detailed neutron-scattering experiments on powder and single crystals of the orthorhombic phase of undoped \( LaMnO_{3} \) . The temperature dependence of the sublattice magnetization has been determined in the antiferromagnetic phase ( \( T_{N}=139.5~K \) ), and the critical exponent is \( \beta=0.28 \) , well below that corresponding to a pure three-dimensional Heisenberg antiferromagnet. We have measured the dispersion of the spin waves propagating in the highest symmetry directions solving the problems related to twinning. The whole spin wave spectrum is well accounted for with a Heisenberg Hamiltonian and a single ion anisotropy term responsible for the easy magnetization direction (b axis). This term induces a gap of 2.7 meV at low temperature in the spin wave dispersion curve. An important result is that the ferromagnetic exchange integral ( \( J_{1}\approx0.83~meV \) ), coupling the spins within the ferromagnetic basal plane (a,b), is larger by a factor 1.4 than the antiferromagnetic exchange integral ( \( J_{2}\approx-0.58~meV \) ) coupling spins belonging to adjacent \( MnO_{2} \) planes along c. [S0163-1829(96)08545-1]
I. INTRODUCTION
The discovery of giant magnetoresistance in hole-doped manganese oxides \( ^{1} \) of perovskite type, \( R_{1-x}A_{x}MnO_{3} \) (R = La, Pr, Nd, ... and A = Ca, Sr, Ba, Pb, ...), has aroused renewed and extended interest in these compounds. It has been known for a long time \( ^{2} \) that the structural and magnetic phase diagrams of these doped compounds are very complex. Though the main qualitative features of these phase diagrams are well known, extensive experimental work is still needed for a fine characterization. According to the scheme given by Torrance et al., \( ^{3} \) the parent compound \( LaMnO_{3} \) is in the limit of the Mott-Hubbard and charge transfer insulators (some recent electronic structure calculations indicate that \( LaMnO_{3} \) belongs to the latter category \( ^{4} \) ). Using the ionic limit as a first approximation, the electron configuration of \( Mn^{3+} \) ions is \( t_{2g}^{3}e_{g}^{1} \) , so that the three electrons in the \( t_{2g} \) orbitals are localized, contributing to a total spin 3/2. The electron in the \( e_{g} \) atomic orbitals is actually strongly \( \sigma \) hybridized with a \( O^{2-} \) p orbital of a neighboring anion. This electron can become itinerant when holes (empty \( e_{g} \) orbitals) are present. In pure \( LaMnO_{3} \) , the Hund rule and the orbital ordering due to the cooperative Jahn-Teller effect, induce local S=2 spins, ferromagnetically coupled in the basal plane and antiferromagnetically coupled in the direction perpendicular to this plane. \( ^{5,6} \) The strong distortion of the \( MnO_{6} \) octahedra is the signature of the cooperative Jahn-Teller effect acting in this compound. \( ^{7} \) On doping the pure system with alkaline earth elements (0.1≤x≤0.33), holes appear in the \( e_{g} \) band and for some value of the hole concentration an insulator-to-metal transition occurs at certain temperatures generally associated with the ferromagnetic Curie temperature. Actually the antiferromagnetic phase is progressively destroyed by the ferromagnetic coupling induced by the hopping of the \( e_{g} \) electron from a \( Mn^{3+} \) ion in the corresponding hole of a neighboring \( Mn^{4+} \) . This double exchange (DE) coupling mechanism was introduced by Zener \( ^{8} \) and developed by Anderson and Hasegawa \( ^{9} \) and de Gennes. \( ^{10} \) The ferromagnetic DE interaction dominates the system for low concentration of holes ( \( x\leq0.3 \) ), where the conductivity is strongly enhanced in the ferromagnetic phase. By increasing the hole concentration, the Coulomb repulsion between electrons becomes stronger and the system prefers to reduce their kinetic energy by a new localization process. So new antiferromagnetic insulating phases can appear corresponding to a long range “charge ordering” (Wigner crystallization) process. \( ^{5,11,12} \) resulting in an ordered array of \( Mn^{3+} \) and \( Mn^{4+} \) ions. The interplay of structural, transport, and magnetic properties on these highly correlated electron systems is extremely interesting and deserves a deep and detailed study.
Until now, no detailed work has been published concerning the experimental determination of the exchange integral in \( LaMnO_{3} \) . It seems worthwhile, before undertaking the study of hole-doped perovskites, to fully determine the microscopic magnetic properties of the undoped compound as a starting point of the series.
Neutron scattering is a well suited tool to study static and dynamic magnetic properties of these materials. Since the pioneering work of Wollan and Koelher \( ^{5} \) on \( (\mathrm{La},\mathrm{Ca})\mathrm{MnO}_{3} \) only few neutron powder diffraction measurements were undertaken on similar systems \( ^{11} \) before the giant magnetoresistance discovery. Inelastic scattering experiments on single crystals of \( Nd_{0.5}Pb_{0.5}MnO_{3} \) were performed by Clausen et al. \( ^{13} \) Very recently inelastic neutron scattering measurements on Sr-doped compounds have been announced. \( ^{14} \)
In this article we present a complete study of magnetic order and magnetic excitations in undoped orthorhombic \( LaMnO_{3} \) . After solving the difficulties encountered by the fact that our single crystal was twinned, we have determined the spin wave dispersion curves along the main high symmetry directions. A coherent interpretation of all the experimental results can be obtained by using a three-dimensional
TABLE I. Crystallographic and magnetic parameters of \( LaMnO_{3} \) obtained by Rietveld refinement at the diffractometer G4.2 using neutrons of \( \lambda=2.59 \) Å at T=1.4 K. The space group is \( Pbnm \) . The numbering of Mn atoms in the unit cell is \( Mn1(1/2,0,0) \) , \( Mn2(1/2,0,1/2) \) , \( Mn3(0,1/2,1/2) \) , and \( Mn4(0,1/2,0) \) . The basis function describing the magnetic structure is \( [G_{x},A_{y},F_{z}]\approx[0,A_{y},0] \) , corresponding to the irreducible representation \( \Gamma_{4g}(--) \) of \( Pbnm \) for k=0 (Ref. 17). The magnetic moments of the four Mn atoms follow the sequence \( A_{y}(+--+) \) . So constituting ferromagnetic (a,b) planes of magnetic moments aligned along b coupled antiferromagnetically along c.
| Atom&Wyckoff site | x | y | x |
| La (4c) | -0.0095(5) | 0.0513 (7) | 1/4 |
| Mn (4b) | 1/2 | 0 | 0 |
| \( \mu \) (Mn) ( \( \mu_{B} \) ) \( ^{a} \) | 0 | 3.87 (3) | 0 |
| O(1) (4c) | 0.0777(7) | 0.48493(80) | 1/4 |
| O(2) (8d) | 0.7227(5) | 0.3085 (5) | 0.0408(4) |
| Distances Mn-O in the \( MnO_{6} \) octahedra: | |||
| m (medium) \( Mn-O(1)=1.966(1) \) | |||
| s (short) \( Mn-O(2)=1.914(3) \) | |||
| l (long) \( Mn-O(2)=2.181(3) \) | |||
| Cell parameters (T=1.4 K): \( a=5.5333(2) \) Å, \( b=5.7461(2) \) Å, \( c=7.6637(4) \) Å | |||
| Reliability factors (%): \( R_{P}=9.58 \) , \( R_{WP}=10.1 \) , \( R_{nuclear}=4.84 \) , \( R_{magnetic}=4.12 \) | |||
| \( \chi^{2}=2.82 \) | |||
\( ^{a}\mu_{x} \) and \( \mu_{y} \) have been fixed to zero in the refinement.
Heisenberg model with a single ion anisotropy. Two exchange parameters suffice to explain all the observed spin waves dispersion relations: \( J_{1} \) couples ferromagnetically nearest neighbors \( Mn^{3+} \) ions in the basal plane (a,b), and \( J_{2} \) couples antiferromagnetically nearest neighbors \( Mn^{3+} \) ions along c.
II. EXPERIMENT
A single crystal of \( LaMnO_{3} \) of about \( 1\ cm^{3} \) with \( 0.6^{\circ} \) mosaic spread, was grown by a floating method associated with an image furnace \( ^{15,16} \) at the “Laboratoire de Chimie des Solides” in Orsay. The starting powder was prepared by solid-state reaction of stoichiometric amounts of \( La_{2}O_{3} \) and \( MnO_{2} \) , \( La_{2}O_{3} \) being fired in air at \( 900\ ^{\circ}C \) before use. The resulting powder was pressed into cylinders under a hydrostatic pressure of 2 kbar and sintered in air at \( 1150\ ^{\circ}C \) . They were used as feed and support rods, respectively, in the floating zone experiments carried out at a growth rate of 1 cm per hour. The procedure used for synthesizing the crystal produced nearly stoichiometric \( LaMnO_{3} \) with no presence of \( Mn^{4+} \) ion as indicated by NMR measurements.
Neutron powder diffraction was performed on samples obtained by crushing single crystal aggregates obtained in the same conditions as the single crystal used in this study. The diffractometers 3T2, G4.2, and G4.1, at the reactor Orphée of the Laboratoire Léon Brillouin, were used to characterize the powder samples. The powders were of an extremely good quality and structural and magnetic data will be published separately. Here we give in Table I the relevant structural and magnetic data obtained at 1.5 K on the diffractometer G4.2.
The single crystal used in this study was actually twinned (see below). The sample was mounted on an aluminium block in a double stage helium closed cycle cryogenerator. The regulation of the temperature was driven by a digital temperature controller (made by “BARRAS,” France) and the stability was better than \( \pm0.02 \) K in the whole temperature range.
Single crystal neutron scattering experiments were carried out on triple axis spectrometers at LLB. Elastic scattering was measured on the triple axis G4.3 installed in the neutron guide hall. This guide looks at a cold neutron source specially suited to study the thermal behavior of the magnetic order parameter (MOP) from magnetic Bragg reflections. Neutrons of incident wave vector of \( 2.662\ \AA^{-1} \) ( \( \lambda=2.36\ \AA \) ) were used together with a graphite filter to eliminate higher order contamination, and a flat graphite analyzer. A q resolution of \( 0.028\ \AA^{-1} \) (FWHM) is obtained through a longitudinal scan across the (001) antiferromagnetic Bragg reflection. In this “elastic” configuration the frequency resolution of the spectrometer is \( 0.2\ \mathrm{THz} \) (FWHM, \( 0.83\ meV \) ), ensuring a complete frequency integration of the dynamic fluctuations near \( T_{N} \) . This allows a good separation of short range order correlations from long range order ones.
Inelastic neutron scattering experiments were performed on the thermal triple axis spectrometer 1 T, equipped with vertically focusing monochromator and horizontally focusing analyzer. For low temperature experiments, we performed positive energy transfer scans at constant scattered neutron wave vector \( k_{F}=2.662\ \AA^{-1} \) , using a graphite filter before analyzer. Typical collimation conditions were \( 25' \) - \( 30' \) - \( 50' \) - \( 50' \) . Magnons were measured in different magnetic and nonmagnetic Brillouin zones, (001), (111), (221), (002), (003), (331),..., and along the main symmetry directions. The indexing is given with respect to the Pbnm orthorhombic setting according to crystallographic data gathered in Table I. The magnetic structure is schematically represented in Fig. 1.
III. DOMAIN STRUCTURE OF THE CRYSTAL
Twinning in perovskites is a very common phenomenon. The occurrence of a domain (or even a microdomain) struc-


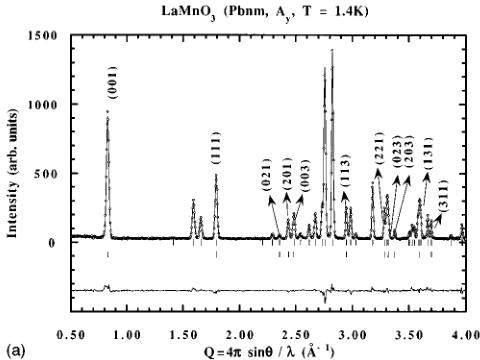
FIG. 1. (a) Refined powder diffraction pattern at 1.4 K. Open circles represent the observed pattern; continuous lines represent calculated and difference (obs-calc) patterns. Tick markers correspond to the position of the allowed Bragg reflections. The second row are the magnetic reflections (indices are explicitly given) allowed by the \( [0_{A},0] \) mode. (b) Scheme of the magnetic structure of \( LaMnO_{3} \) . Only manganese ions are represented with magnetic moments along b. The (001) planes constitute ferromagnetic layers coupled antiferromagnetically along c.
ture in perovskites is due to the fact that at high temperature the aristotype cubic \( Pm3m \) structure is the most stable phase. On cooling, a series of phase transitions may occur due to steric and/or electronic effects. The lower symmetry of these phases generates domains related by symmetry operators lost through the transition. The particular pattern obtained in a crystal may depend on temperature gradients and mechanical stresses during the thermal history. The obtention of a single domain crystal is often impossible even by applying external fields favouring the development of a particular domain. In perovskites of \( Pbnm \) structure (cell \( a_{c}\sqrt{2}\times a_{c}\sqrt{2}\times2a_{c} \) ) up to six orientational domains can exist (the index of mmm in 3m is 6). The orthorhombic c axis can be oriented along the \( \langle100\rangle \) directions of the high temperature cubic cell. These are domains related by fourfold symmetry axes lost in the orthorhombic phase. This type of domain produces regions of the multidomain sample where orthorhombic \( \langle110\rangle \) directions are parallel (if we neglect lattice distortions) to orthorhombic \( \langle001\rangle \) in other regions. If we

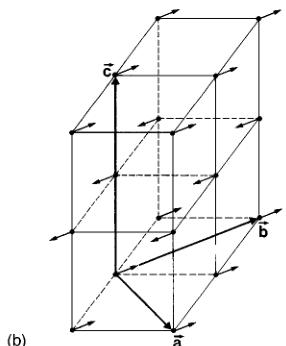
FIG. 2. Reciprocal space construction showing the superposition of three F domains (see text). Bragg indices with + symbol refer to the domain labelled 1 (indices for domains 2 and 3 are not indicated). Actually the quadrant of the scattering plane selected for this study contains the axis \( [110]_{1}^{*} \) and the axis \( [001]_{1}^{*} \) instead of \( [001]_{1}^{*} \) , but for simplicity reasons the sign - has been systematically omitted. \( [110]_{1,3}^{*} \) means that this direction belongs to both domain 1 and domain 3. Note that the Bragg point \( (1,1,2)_{1} \) is very close to the \( (2,0,0)_{3} \) one. \( \triangle \) represents one peculiar path where spectra have been measured (see Fig. 4) crossing (001) point A and (111) point C belonging to domain 1 [actually (001)) and (111)]. \( \bullet \) is a zone boundary point B of domain 1 on the path \( \triangle \) .
take into account the lattice distortions, slight misorientations can occur giving rise to additional tilted domains. We call these domains F domains. Moreover, the mirror planes \( \{100\} \) of the cubic aristotype containing the orthorhombic c axis generate twins where a and b axes are interchanged. The twins generated by such mirror planes are coherent and misoriented by an angle \( \varepsilon=2\tan^{-1}(r)-\pi/2 \) , with r=b/a. We call these domains M domains. Similar to M domains there are also F domains with a and b along a single direction without misorientation. In such a case the directions \( \langle110\rangle^{*} \) of the two domains form an angle \( \varepsilon^{\prime}=\cos^{-1}\{2r/(1+r^{2})\} \) .
In our experiment we have aligned the crystal in such a way that reflections \( \{220\} \) and \( \{004\} \) are in the horizontal plane. Along the directions \( \langle110\rangle^{*} \) , we also found reflections of type \( \{004\} \) indicating the presence of F domains. The reflections found in the scattering plane lead us to construct the reciprocal lattices corresponding to the interpenetrating domains existing in our crystal. A simplified reciprocal space scheme showing the main directions accessible in the scattering plane for the different domains is depicted in Fig. 2. In the present case only three different F domains coexist.
The obvious consequence of this situation is that a given path in the scattering plane actually corresponds to three paths of distinct symmetry, so that three dispersion curves can be simultaneously measured. This number is reduced to two when symmetry relations between the domains cause a degeneracy. An example of this situation is given in Figs. 2 and 3. Along the path \( \Delta \) in the scattering plane (Fig. 2) three dispersion curves have been measured and are represented on Fig. 3. The curve (1) is the spin wave dispersion along the \( [110]^{*} \) direction of domain 1. It exhibits a gap at the zone

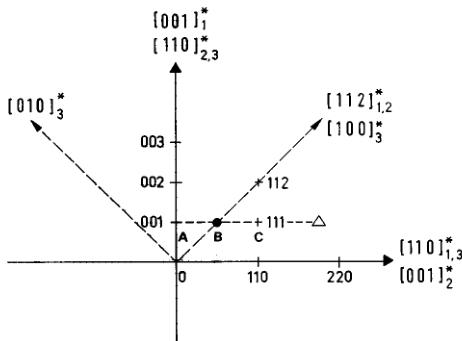
FIG. 3. Spin wave dispersion curves obtained simultaneously when scanning along the path \( \triangle \) of the reciprocal space depicted in Fig. 2. Each one is attached to a domain, numbered (1), (2), or (3), referring to the three domains of Fig. 2.
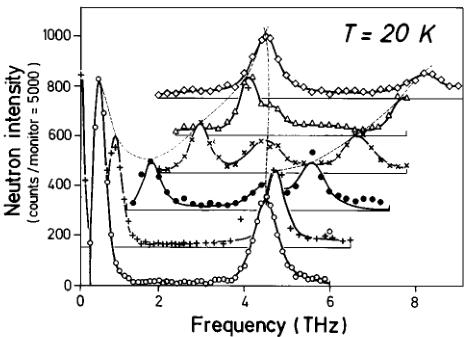
center \( \{001\} \) point A on Fig. 2 and a maximum frequency at the zone boundary (point B on Fig. 2). This curve is perfectly symmetric with respect to point B. The dispersion curve (2) corresponds to domain 2 with its \( [001]^{*} \) direction parallel to the path ABC but with \( q_{H}=q_{K}=0.5 \) . For this domain, the ABC path lies along a zone boundary. The dispersion curve (3) corresponds to spin waves propagating in domain 3. Point A is at the zone boundary in a \( [110]^{*} \) direction and point B is at the zone boundary in the \( [100]^{*} \) direction. Example of spectra of spin waves propagating in the \( [110]^{*} \) direction of domain 1 which have allowed the construction of Fig. 3 are shown in Fig. 4. One can clearly see three magnons, sometimes reduced to two because of high symmetry points. The three ridges represent the three dispersion curves of Fig. 3. Along \( [001]^{*} \) and \( [110]^{*} \) axes, only two spin wave branches have been measured due to symmetry relation as shown in Fig. 2. There is a small shift in the spin wave gap measured in domains 2 or 3 with respect to that measured in domain 1, which is fully explained by the slight misorientation of those domains 2 or 3 with respect to domain 1.
The whole experimental results collected for the three domains are coherently interpreted within the experimental error by using the same set of anisotropy term and exchange parameters.
IV. MAGNETIC ORDER PARAMETER
This study was undertaken in order to determine the characteristics of the antiferromagnetic transition of \( LaMnO_{3} \) : the transition temperature \( T_{N} \) and the critical exponent \( \beta \) of the sublattice magnetization which corresponds to the magnetic order parameter (MOP). There is no spin reorientation below \( T_{N} \) . Thus the magnetic structure (as described in Table I and Fig. 1) is strictly the same in the whole tempera-

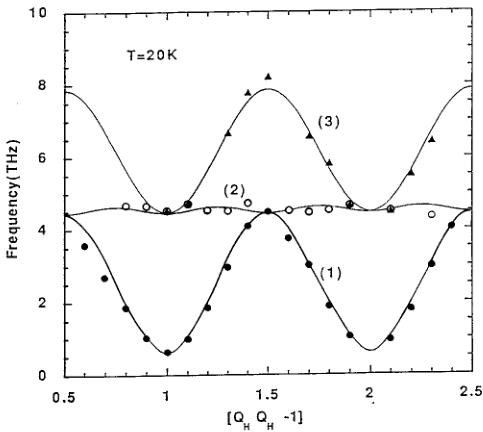
FIG. 4. Energy spectra corresponding to the spin wave dispersion curves shown in Fig. 2, and obtained at the five \( Q=(q_{H},q_{K},q_{L}) \) values. (☐): \( Q=\{1,1,1\} \) ; (+) : \( Q=\{1,1,1,1\} \) ; (●): \( Q=\{1,2,1,2\} \) ; (×): \( Q=\{1,3,1,3,1\} \) ; (△): \( Q=\{1,4,1,4,1\} \) ; (◇): \( Q=\{1,5,1,5,1\} \) . For clarity, the origin of the intensity of each spectrum (continuous horizontal line) has been shifted by a constant value (175). The continuous curves through the data points correspond to calculated profiles (as explained in the text). The three ridges (dotted lines) represent the dispersion curves of Fig. 3.
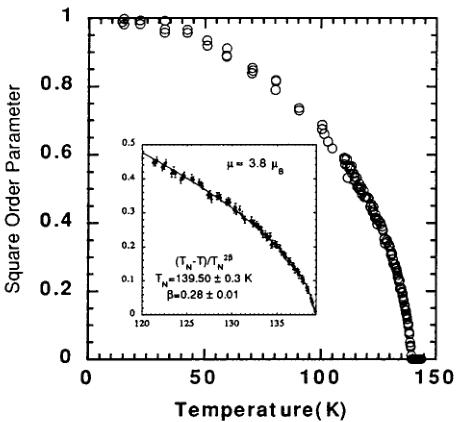
ture range, only the magnitude of the MOP changes. The thermal evolution of the MOP and its fluctuations were deduced from \( [0,0,1+\zeta]^{*} \) elastic scans through the antiferromagnetic Bragg reflection (001). At each temperature the intensity profile of the scan is fitted with the sum of two components (one is a Gaussian and the other is a Lorentzian) convoluted with the resolution function of the spectrometer. The Gaussian component has a constant width independent of temperature. The FWHM is small ( \( 0.012\ \AA^{-1} \) ) compared to the resolution of the spectrometer. This Gaussian component is connected to the long range order parameter and its intensity is proportional to the square of the MOP. On the other hand, the Lorentzian component (if it exists) represents short range order correlations. Although the nuclear Bragg reflection (001) is forbidden in the space group \( Pbnm \) , a small intensity persists at temperatures much higher than \( T_{N} \) . This can be due to either multiple scattering or second order contamination despite the presence of a graphite filter. So the square of the MOP was evaluated using the difference between the intensities of the Gaussian at a given temperature and the corresponding intensity at high temperature. This difference was normalized by dividing it by the magnetic intensity measured at 14 K (the lowest temperature of the study). So \( \mu^{2}(T)=[I(001)_{T}-I(001)_{HT}]/I(001)_{14\ \mathrm{K}} \) . The result is plotted on Fig. 5. \( T_{N} \) was determined using different procedures: \( T_{N} \) was taken (i) as the inflexion point in the plot of the raw magnetic intensity vs temperature, (ii) as the point where the diffuse scattering (Lorentzian component) is maximum, and (iii) as the temperature from which the intensity of the Gaussian remains constant for increasing temperature. The average value of these temperatures is \( T_{N}=139.5\pm0.3 \) K. This agrees with the published values. \( ^{6} \) Then the fit of the slope of the \( \ln\{\mu^{2}(T)\} \) versus \( \ln\{[I(T)] \)

FIG. 5. Magnetic order parameter as a function of temperature. In the inset is shown the fit used to determine the critical exponent.
\( -T_{N})/T_{N}| \) plot between 120 K and just below \( T_{N} \) gives a critical exponent \( \beta=0.28 \) for \( T_{N}=139.5 \) K kept fixed in the fit. If \( T_{N} \) is changed by \( \pm0.3 \) K, \( \beta \) changes by \( \pm0.01 \) . This \( \beta \) value is smaller than the theoretical critical exponent of a pure three-dimensional Heisenberg Hamiltonian \( \beta=0.36 \) . This fact has been theoretically explained. \( ^{[18]} \) Anticipating the analysis of the results of spin waves measurements, we demonstrate that a Heisenberg model plus a rather important single ion anisotropy in the Hamiltonian, fairly accounts for the experimental results. It is this anisotropy term which is responsible for the reduction of \( \beta \) with respect to the expected value of 0.36. Nearly the same \( \beta \) value is found in ferromagnetic Sr-doped compounds. \( ^{[14]} \)
V. SPIN WAVES
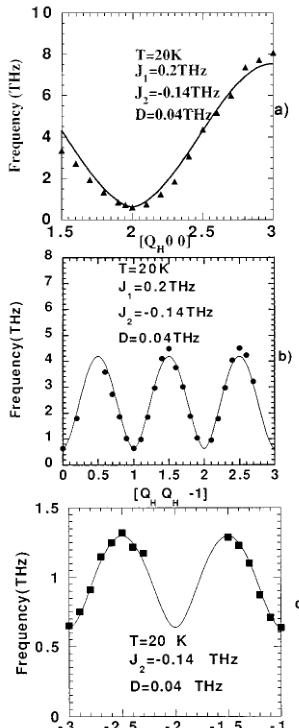
Inelastic neutron scattering has allowed the measurements of the spin waves propagating in \( LaMnO_{3} \) . Figure 6 represents the dispersion curves of spin waves along \( [100]^{*} \) , \( [110]^{*} \) , and \( [001]^{*} \) directions obtained with a single orientation of the crystal (because of the twinning, see Sec. III). The magnetic origin of these modes was checked by varying the temperature. The lower frequency modes become rapidly overdamped above \( T_{N} \) while the higher frequency modes persist well above \( T_{N} \) . They cannot be confused with phonons because of a general smearing out of their intensity with increasing temperature. The dispersion curves have been established with the following method: each magnon is considered as an underdamped harmonic oscillator. This corresponds to a theoretical neutron cross section which is convoluted with the triple axis spectrometer resolution function. The resulting calculated intensity is then compared to the measured intensity in a fitting process where the frequency and the width of the magnon are adjustable parameters. The quality of this calculation can be appreciated on spectra of Fig. 4, the continuous lines are the calculated profiles. We found moderated damping constants, their order of magni-

FIG. 6. Fit of the dispersion curves along the \( [100]^{*} \) , \( [110]^{*} \) , and [001]^{*} directions providing the set of parameters \( J_{1} \) , \( J_{2} \) , and D. Data points around \( \{002\} \) have been omitted. The weak intensity of magnons together with their mixing with those of \( [110]^{*} \) direction of F-domain prevented extracting them properly.
tude is that of the frequency resolution.
The following features can be drawn.
(i) A spin wave gap of 2.7 meV is observed which can be explained by a single ion anisotropy term in the Hamiltonian. According to the magnetic structure determination, spins are essentially aligned along b. So we have to include in the total Hamiltonian a single ion anisotropy term: \( -D\Sigma_{i}S_{i}^{z^{2}} \) (z axis being along b).
(ii) The parameters of the unit cell are close to \( a_{c}\sqrt{2}\times a_{c}\sqrt{2}\times2a_{c} \) , with \( a_{c} \) being the pseudocubic subcell, the corners of which are close to the true positions of the \( Mn^{3+} \) ions. So the symmetry of the spin wave dispersion curves along c displays quite well the antiferromagnetism along that direction. This is in complete agreement with the observed magnetic structure.
(iii) Along \( [100]^{*} \) direction the frequency is maximum at \( q_{H}=1 \) . This agrees with the \( Pbmn \) group extinction rule for odd h-index of \( (h00) \) reflections. It means that the spin waves are measured in an extended zone scheme and confirms the physical prevalence of the small distorted square
formed by the \( Mn^{3+} \) ions in the basal plane (a,b). So, disregarding the distortion, the magnetic unit cell relevant for spin waves is \( a_{c} \times a_{c} \times 2a_{c} \) .
(iv) Finally, the maximum frequency is much higher along \( [100]^{*} \) than along \( [001]^{*} \) indicating that the exchange integral is larger between nearest neighbors in the basal plane (a,b) than between nearest neighbors along the c axis.
The observed magnon dispersion relations have been compared to standard calculations of spin wave modes using an anisotropic three-dimensional Heisenberg Hamiltonian including a single ion anisotropy term. This anisotropy term is of a simpler form than that used by Matsumoto. \( ^{6} \) We neglect the small ferromagnetic component of spins along \( [001] \) direction that cannot be safely obtained by analysing the integrated intensities of Bragg peaks. This ferromagnetic component exists also in orthoferrites and can be attributed to a small antisymmetric Dzialoshinski-Moriya coupling. \( ^{17} \) The component of spins along a is also neglected because the magnetic reflections are too weak to be safely measured by conventional methods. This last component could come from anisotropic exchange interactions that we neglect in our treatment. The most simple Hamiltonian explaining our results is
\[ \mathcal{H}=-\sum_{i,j}J_{i j}(S_{i}\cdot S_{j})-D\sum_{i}S_{i}^{2}. \quad (1) \]
Only two exchange integrals are necessary: \( J_{1} \) between nearest neighbors in the basal plane (a,b) and \( J_{2} \) between nearest neighbors along c. The classical Holstein-Primakoff approximation \( ^{19} \) for spin waves propagating with the reduced wave vector \( q=q_{H}a^{*}+q_{K}b^{*}+q_{L}c^{*} \) , and S lying along \( b^{*} \) for Mn ions at z=0 and opposite for Mn ions at z=1/2 is used. The following dispersion law is deduced:
\[ \begin{aligned}\omega(\mathbf{q})=2S\sqrt{A(\mathbf{q})^{2}-B(\mathbf{q}^{2})},\\A(\mathbf{q})=&A(q_{H},q_{K},q_{L})\\=&2J_{1}[2-\cos(\pi(q_{H}+q_{K}))-\cos(\pi(q_{H}-q_{K}))]\\&-2J_{2}+D,\end{aligned} \quad (2) \]
\[ B(\mathbf{q})=B(q_{H},q_{K},q_{L})=-2J_{2}\cos(\pi q_{L}). \quad (2) \]
Taking S=2 as the value of the spin of \( Mn^{3+} \) ions, the best fit gives
\[ \begin{aligned}J_{1}=&0.2\mathrm{~THz~}(or0.83\mathrm{~meV~}or9.6\mathrm{~K})\pm0.01\mathrm{~THz},\\&J_{2}=-0.14\mathrm{~THz~}(or-0.58\mathrm{~meV~}or-6.7\mathrm{~K})\\&\pm0.005\mathrm{~THz},\end{aligned} \]
\[ D=0.04\mathrm{~THz~}(or0.165\mathrm{~meV~}or1.92\mathrm{~K})\pm0.002\mathrm{~THz}. \]
We note that, with these exchange integral values, simple molecular field calculations give the following paramagnetic Curie and Néel temperatures: \(\Theta_{p}=100\) K and \(T_{N}=207\) K. These values of \(J_{1}, J_{2}\), and \(D\) were obtained as follows: first, \(D\) and \(J_{2}\) were determined from the fit of the dispersion curve along \([001]^{*}\) direction [Fig. 6(c)] with the expression of \(\omega(0,0,q_{L})\) deduced from relations (2). Then these two values \(D\) and \(J_{2}\) were fixed during the fitting process of the dispersion curves along the \([100]^{*}\) and \([110]^{*}\) directions [Figs. 6(a) and 6(b)] which provides the value of \(J_{1}\). This set of values has been used to calculate the spin wave frequencies along all the investigated paths in the reciprocal space. An other example of comparison between calculated (with the above parameter values) and observed dispersion relations is given in Fig. 3.
Several comments have to be made. If the fits of the dispersion curves in the (a,b) plane are performed allowing the three fitting parameters \( J_{1} \) , \( J_{2} \) , D to vary freely, the best value of \( J_{2} \) approaches zero. A nonzero value of \( J_{2} \) gives to these dispersion curves a steeper feature near the zone center than what is actually observed. It also leads to a lower frequency at the zone boundary especially along [100] \( ^{*} \) . However, this discrepancy moderately affects the whole results.
The sign of the exchange integrals, found positive for \( J_{1} \) and negative for \( J_{2} \) , are in good agreement with the observed A-type magnetic structure, confirming in that sense the predictions based on the nature of superexchange interactions between \( Mn^{3+} \) ions through oxygens, the so called Goodenough-Kanamori rules. \( ^{[20,21]} \) The key argument used by Goodenough to explain the magnetic structure of \( LaMnO_{3} \) was based on the existence of an “orbital ordering” of the two \( e_{g} \) components \( d_{x^{2}-y^{2}} \) and \( d_{3z^{2}-r^{2}} \) . This orbital ordering results from the cooperative Jahn-Teller effect taking place as a consequence of the breaking of orbital degeneracy of the \( E_{g} \) state by coupling to phonons. \( ^{[20]} \) This is experimentally observed from the distortion of \( MnO_{6} \) octahedra (see Table I). The antiferrodistorsive orbital ordering in the basal plane [the Mn-O(2)-Mn path is formed by a short and a long bond] overlaps nearly half-filled with nearly empty orbitals through 2p-oxygen orbitals, so the superexchange interaction is ferromagnetic. \( ^{[20,21]} \) Along c, Mn atoms are connected by O(1) so only one type of bond exists in the Mn-O(1)-Mn path. Therefore, the same orbital is involved in adjacent bonds and the superexchange is antiferromagnetic. So, as stated above, the signs of \( J_{1} \) and \( J_{2} \) are in total agreement with the theoretical qualitative predictions of Goodenough. However, the Goodenough-Kanamori rules predict a strong antiferromagnetism only if the Mn-O-Mn bond along c axis is a \( 180^{\circ} \) bond and with half-filled d orbitals. These conditions are not fullfilled in pure \( LaMnO_{3} \) (Mn-O-Mn bonds form angles less than \( 180^{\circ} \) and d orbitals are less than half-filled). So antiferromagnetic exchange is not as strong as one could expect. Preliminary results on Ca doped compound show its extreme sensitivity even for a weak doping.
In conclusion we have fully determined the magnetic interactions in \( LaMnO_{3} \) despite difficulties induced by the twinning of the crystal. A Heisenberg model with a single ion anisotropy accounts fairly well for the experimental results. The anisotropy and the sign of exchange integrals are in good agreement with both magnetic structure and the qualitative predictions based on Goodenough-Kanamori rules.
\( ^{1} \) R. von Helmolt, J. Wecker, B. Holzapfet, L. Schultz, and K. Samwer, Phys. Rev. Lett. 71, 2331 (1993); R. von Helmolt, J. Wecker, K. Samwer, L. Haupt, and K. Bärner, J. Appl. Phys 76, 6925 (1994); S. Jin, M. McCormack, T. H. Tiefel, and R. Ramesh, ibid. 76, 6929 (1994); Y. Tokura, A. Urushibara, Y. Morimoto, T. Arima, A. Asamitsu, G. Kido, and N. Furukawa, J. Phys. Soc. Jpn. 63, 3931 (1994).
\( ^{2} \) G. H. Jonker and J. H. Van Santen, Physica 16, 337 (1950); 19, 120 (1953); G. H. Jonker, ibid. 22, 707 (1956).
\( ^{3} \) J. B. Torrance, P. Lacorre, G. Asavaoengchai, and R. Metzger, J. Solid State Chem. 90, 168 (1991); Physica C 182, 351 (1991).
\( ^{4} \) S. Satpathy, Z. S. Popovic, and F. R. Vukajlovic, Phys. Rev. Lett. 76, 960 (1996).
\( ^{5} \) E. O. Wollan and W. C. Koehler, Phys. Rev. 100, 545 (1955); W. C. Koehler and E. O. Wollan, J. Phys. Chem. Solids 2, 100 (1957).
\( ^{6} \) G. Matsumoto, J. Phys. Soc. Jpn. 29, 606 (1970); 29, 615 (1970).
\( ^{7} \) J. Kanamori, J. Appl. Phys. Suppl. 31, 14S (1960).
\( ^{8} \) C. Zener, Phys. Rev. 81, 440 (1951); 82, 403 (1951); J. Phys. Chem. Solids 8, 26 (1959).
\( ^{9} \) P. W. Anderson and H. Hasegawa, Phys. Rev. 100, 675 (1955).
\( ^{10} \) P. G. de Gennes, Phys. Rev. 118, 141 (1960).
\( ^{11} \) Z. Jirák, S. Krupicka, Z. Simsa, M. Dlouhá, and S. Vratislav, J. Magn. Magn. Mater. 53, 153 (1985).
\( ^{12} \) Y. Tomioka, A. Asamitsu, Y. Moritomo, H. Kuwahara, and Y. Tokura, Phys. Rev. Lett. 74, 5108 (1995).
\( ^{13} \) K. N. Clausen, W. Hayes, D. A. Keen, R. M. Kusters, R. L. McGreevy, and J. Singleton, J. Phys. Condens. Matter 1, 2721 (1989).
\( ^{14} \) M. C. Martin, G. Shirane, Y. Endoh, K. Hirota, Y. Moritomo, and Y. Tokura, Phys. Rev. B 53, 14 285 (1996); H. Moudden et al., Czech. J. Phys. 46 (Suppl. S4), 2163 (1996).
\( ^{15} \) A. Revcolevschi and R. Collongues C. R. Acad. Sci. (Paris) 266, 1797 (1969).
\( ^{16} \) A. Revcolevschi, Rev. Int. Htes. Temps. 7, 73 (1970).
\( ^{17} \) See, for instance, E. F. Bertaut, in Magnetism, edited by G. T. Rado and H. Sull (Academic, New York, 1963), Vol. III, pp. 149–209.
\( ^{18} \) P. Pfeuty, D. Jasnow, and M. E. Fisher, Phys. Rev. B 10, 2089 (1974).
\( ^{19} \) T. Holstein and H. Primakoff, Phys. Rev. 58, 1098 (1940).
\( ^{20} \) J. B. Goodenough, Phys. Rev. 100, 564 (1955).
\( ^{21} \) J. Kanamori, J. Phys. Chem. Solids 10, 87 (1959).
 p3_0.jpg
 p3_1.jpg
 p3_2.jpg
 p4_0.jpg
 p4_1.jpg
 p5_0.jpg
 p5_1.jpg