| Transition Temperature | 960 K |
|---|---|
| Experiment Temperature | 300 K |
| Propagation Vector | k1 (0, 0, 0) |
| Parent Space Group | Pm-3m (#221) |
| Magnetic Space Group | R-3m' (#166.101) |
| Magnetic Point Group | -3m' (20.5.75) |
| Lattice Parameters | 3.77 3.77 3.77 90.00 90.00 90.00 |
|---|---|
| DOI | 10.1063/1.371298 |
| Reference | I. Tomeno, H.N. Fuke, H. Iwasaki, M. Sahashi and Y. Tsunoda, Journal of Applied Physics (1999) 86 3853-3856. |
| Label | Element | Mx | My | Mz | |M| |
|---|---|---|---|---|---|
| Mn1 | Mn | 2. | -1. | -1. | 2.45 |
Magnetic neutron scattering study of ordered Mn 3 Ir
Izumi Tomeno, Hiromi N. Fuke, Hitoshi Iwasaki, Masashi Sahashi, and Yorihiko Tsunoda
Citation: Journal of Applied Physics 86, 3853 (1999); doi: 10.1063/1.371298
View online: http://dx.doi.org/10.1063/1.371298
View Table of Contents: http://scitation.aip.org/content/aip/journal/jap/86/7?ver=pdfcov
Published by the AIP Publishing
Articles you may be interested in
Magnetic ordering in TbMnO.5CrO.5O3 studied by neutron diffraction and first-principles calculations J. Appl. Phys. 116, 033919 (2014); 10.1063/1.4890637
Neutron diffraction study of MnNiGa2—Structural and magnetic behaviour J. Appl. Phys. 115, 17A904 (2014); 10.1063/1.4857455
High temperature neutron diffraction studies of 0.9 BiFeO 3 – 0.1 PbTiO 3 J. Appl. Phys. 105, 094108 (2009); 10.1063/1.3116735
Revised magnetic phase diagram for Fe x Mn 5-x Si 3 intermetallics J. Appl. Phys. 95, 6819 (2004); 10.1063/1.1688219
Structure and magnetic studies on UNiAID 2.2 J. Appl. Phys. 89, 7192 (2001); 10.1063/1.1361262

Magnetic neutron scattering study of ordered Mn_{3}Ir
Izumi Tomeno \( ^{a)} \)
Environmental Engineering and Analysis Center, Research and Development Center, Toshiba Corporation, Saiwai-ku, Kawasaki 210-8582, Japan Hiromi N. Fuke, Hitoshi Iwasaki, and Masashi Sahashi
Storage Materials and Devices Research Laboratory, Research and Development Center, Toshiba Corporation, Saiwai-ku, Kawasaki, 210-8572, Japan Yorihiko Tsunoda
School of Science and Engineering, Waseda University, Shinjuku-ku, Tokyo 169-8555, Japan
(Received 5 March 1999; accepted for publication 21 June 1999)
Neutron-diffraction measurements were made on an ordered \( Mn_{3}Ir \) single crystal in a wide temperature range up to 1030 K. The ordered \( Mn_{3}Ir \) alloy was found to maintain an antiferromagnetic (AF) triangular spin structure up to the Néel temperature \( T_{N}=960\pm10 \) K. The lattice parameter a shows a continuous change in the temperature range including \( T_{N} \) . In contrast to the isostructural ordered \( Mn_{3}Pt \) alloy, these observations indicate that an AF-AF phase transition is absent in the ordered \( Mn_{3}Ir \) alloy. © 1999 American Institute of Physics. [S0021-8979(99)01919-2]
I. INTRODUCTION
Considerable interest has been renewed in antiferromagnetism in \( Mn_{1-x}Ir_{x} \) alloys, mainly because ferromagnetic (F) \( Co_{1-x}Fe_{x} \) and antiferromagnetic (AF) \( Mn_{1-x}Ir_{x} \) bilayers give a strong exchange bias in spin-valve structures. \( ^{1,2} \) The application of \( Mn_{1-x}Ir_{x} \) film relies on the magnetic phase diagram established by Yamaoka. \( ^{3,4} \) The Néel temperature \( T_{N} \) in disordered \( \gamma \) -phase \( Mn_{1-x}Ir_{x} \) alloys increases with increasing Ir content from 570 K for x=0.08 to 730 K for x=0.25. This is in marked contrast to the decrease in \( T_{N} \) for \( \gamma \) -Mn alloys such as \( Mn_{1-x}Cu_{x} \) , \( ^{5} \) \( Mn_{1-x}Ni_{x} \) , and \( Mn_{1-x}Pd_{x} \) . \( ^{6} \) In contrast to the AF order, the introduction of Ir decreases the structural phase-transition temperature from face-centered cubic (fcc) to face-centered tetragonal (fct) phases: the fcc–fct transition temperature in \( Mn_{1-x}Ir_{x} \) is 510 K for x=0.08 and 240 K for x=0.13. Thus the fcc–fct transition temperature is considerably lower than \( T_{N} \) . Finally, \( Mn_{1-x}Ir_{x} \) alloys with x>0.15 remain cubic even at low temperatures. The fcc (111)-oriented \( Co_{0.9}Fe_{0.1} \) and \( Mn_{1-x}Ir_{x} \) bilayer gains the high exchange field around x=0.22. \( ^{1} \)
The magnetic structure in a disordered \( Mn_{0.75}Ir_{0.25} \) alloy has been studied using neutron-diffraction experiments. \( ^{3} \) One possibility is the collinear spin state where alternating planes of up and down spins appear along the [001] axis (type-1 antiferromagnet). The alternative is that each spin on the four sublattices is directed along the \( \langle111\rangle \) axis. In practice, it is very difficult for fcc Mn-based alloys to distinguish between the two models.
The Néel temperature \( T_{N} \) for a \( Mn_{0.75}Ir_{0.25} \) alloy is raised by ordering in a \( Cu_{3}Au \) -type crystal structure. \( ^{4} \) The analogous ordered \( Mn_{3}Pt \) alloy exhibits an AF–AF transition below \( T_{N} \) . \( ^{7} \) In contrast, the AF–AF transition is absent from the isostructural ordered \( Mn_{3}Rh \) alloy. \( ^{8} \) This notable difference stimulated us to investigate the magnetic properties of \( Mn_{3}Ir \) .
In this article, we present a neutron-diffraction study of the ordered \( Mn_{3}Ir \) single crystal in a wide temperature range including \( T_{N} \) . The ordered \( Mn_{3}Ir \) alloy is found to maintain a triangular spin structure up to \( T_{N} \) . The ordered magnetic moment and the lattice parameter are derived from the (100) Bragg reflection.
II. EXPERIMENTAL PROCEDURE
A mixture containing 25 at.% Ir was melted, turned, and remelted in an alumina crucible in an Ar atmosphere. The single crystal was grown from the ingot by the Bridgeman method, annealed at 1000 K for three weeks in an evacuated quartz tube, and then cooled to room temperature in a furnace. Neutron-diffraction experiments were performed using a conventional-type triple-axis spectrometer \( T_{1-1} \) installed at a thermal guide of JRR-3M, Tokai. The neutron wavelength was \( \lambda=2.437 \) Å. Bragg reflection intensities for \( Mn_{3}Ir \) were subject to a neutron pass in the sample, due to the large absorption of the neutron beam by the Ir nuclei. To diminish the absorption effect, we shaped the sample into a disk 8 mm in diameter and 2 mm thick. The sample in the furnace was placed with the [110] crystal axis perpendicular to the scattering plane. Neutron-diffraction measurements showed that the annealed sample had the \( Cu_{3}Au \) -type crystal structure. Absence of a diffuse peak around (001) supports that the ordered sample is almost free from the disordered phase.
III. RESULTS AND DISCUSSION
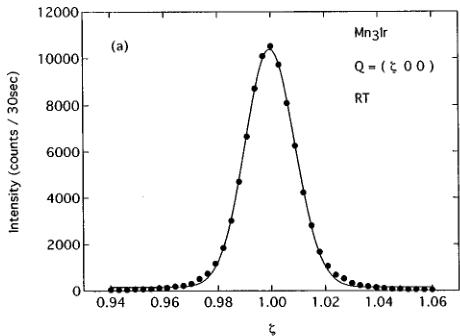
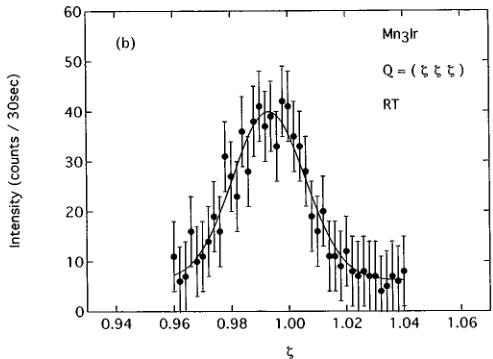
Figure 1 shows the longitudinal (100) and (111) scans in \( Mn_{3}Ir \) at room temperature. Solid lines in Fig. 1 are Gaussian fits to the peak profiles. The ratio of (111)- to (100)-reflection integrated intensities, \( I_{111}/I_{100} \) , is evaluated as \( 9.2 \times 10^{-3} \) . The full width at half maximum (FWHM) of the


FIG. 1. Longitudinal scans around (a) the (100) and (b) the (111) Bragg-peak positions for \( Mn_{3}Ir \) at room temperature. Solid lines are Gaussian fits to the peak profiles.
(111) peak is one and a half times that of the (100) peak. The squares of the nuclear structure factors for two reflections are expressed as
\[ F_{100}^{2}=(b_{\mathrm{Ir}}-b_{\mathrm{Mn}})^{2}, \]
\[ F_{111}^{2}=(b_{\mathrm{Ir}}+3b_{\mathrm{Mn}})^{2}. \]
Using the values for the nuclear scattering length, \( b_{Ir}=10.6 \times 10^{-13} \) cm, and \( b_{Mn}=-3.73 \times 10^{-13} \) cm, we obtain \( F_{100}^{2}=2.05 \times 10^{-24} \) cm \( ^{2} \) and \( F_{111}^{2}=3.5 \times 10^{-27} \) cm \( ^{2} \) . Thus, the low \( F_{111}^{2} \) value can essentially account for the extremely weak intensity of the (111) reflection. The (100) Bragg reflection is the sum of nuclear and magnetic peaks, whereas the (111) reflection represents the nuclear peak. Thus the integrated intensity ratio, \( I_{111}/I_{100} \) , should be less than \( F_{111}^{2}/F_{100}^{2}=1.7 \times 10^{-3} \) . The observed ratio \( I_{111}/I_{100}=9.2 \times 10^{-3} \) is considerably higher than the expected value. The uncertainty due to the neutron absorption does not sufficiently explain this discrepancy. A possible explanation is that the disordered phase gives rise to the enhancement of \( I_{111}/I_{100} \) and the broadening of the (111) linewidth. Since the \( F_{100}^{2} \) value is reduced to zero for the disordered phase, a slight deviation from the perfect ordered phase is expected to enhance \( I_{111}/I_{100} \) .


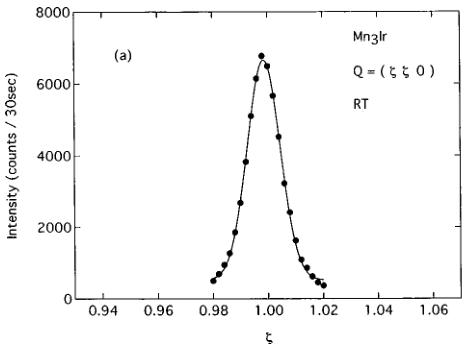
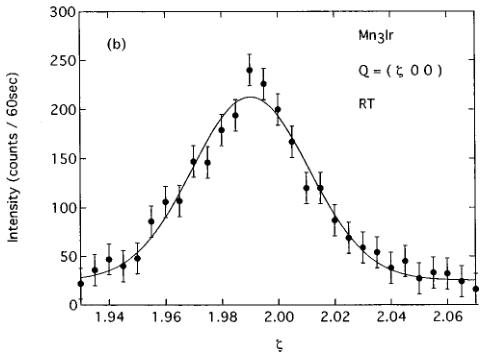
FIG. 2. Longitudinal scans around (a) the (110) and (b) the (200) Bragg-peak positions for \( Mn_{3}Ir \) at room temperature.Solid lines are Gaussian fits to the peak profiles.
Both the nuclear and the magnetic scattering contribute to Bragg reflections (hkl) with integers h, k, and l, except for (hhh). Figure 2 illustrates the longitudinal (110) and (200) scan data at room temperature. The relationships \( F_{110}^{2} = (b_{\mathrm{Ir}} - b_{\mathrm{Mn}})^{2} \) and \( F_{200}^{2} = (b_{\mathrm{Ir}} + 3b_{\mathrm{Mn}})^{2} \) partly explain the obvious difference in intensity between (110) and (200). The FWHM of the (110) peak is comparable to that for the (100) peak. We also point out the similarity between the (200) and the (111) reflections. The broadening of the (hkl) linewidth is observed on the condition that \( F_{hkl}^{2} \) is expressed as \( (b_{\mathrm{Ir}} + 3b_{\mathrm{Mn}})^{2} \) . These results suggest that the inclusion of the clusters of the disordered phase gives rise to the nuclear diffuse scattering around (200) and (111). Figure 1(b) shows that the weak nuclear-peak shifts slightly from the (111) reciprocal lattice point to the smaller scattering angle. The broad peak plotted in Fig. 2(b) also deviates from the (200) reciprocal lattice point. The lattice parameter a for the disordered \( Mn_{0.75}Ir_{0.25} \) alloy is slightly larger than that for the ordered phase. \( ^{4} \) Here the reciprocal lattice is constructed based on the ordered phase. Thus the deviation from the reciprocal lattice point is in favor of the interpretation that the nuclear diffuse scattering mainly originates from the inclusion of the clusters of the disordered phase. The distinction between the (200) and the (111) reflections is that the (111) reflection is free from the magnetic scattering.


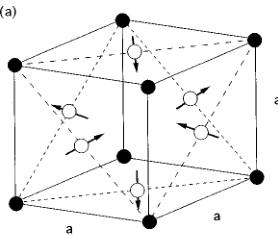
FIG. 3. (a) Antiferromagnetic structure and (b) the corresponding (111) surface spin structure for \( Mn_{3}Ir \) . Open and solid circles represent Mn and Ir atoms, respectively.
The absence of superlattice magnetic peaks is found by scanning along the \( [h00] \) and \( [hh0] \) directions in the range 0<k<2, the \( [hhh] \) direction in the range 0<k<3/2, and the \( [2h0] \) direction in the range 0<k<1. These observations lead to the conclusion that the ordered \( Mn_{3}Ir \) alloys have the triangular spin structure shown in Fig. 3(a). The Mn magnetic moments are parallel to the (111) plane, and aligned in the \( \langle112\rangle \) direction. The same magnetic structure has been proposed for the ordered \( Mn_{3}Rh \) alloy \( ^{8,9} \) and for the low-temperature phase of the ordered \( Mn_{3}Pt \) alloy. \( ^{7} \) The (111)-oriented \( Mn_{3}Ir \) and \( Co_{1-x}Fe_{x} \) bilayer is expected to have a strong exchange coupling. As illustrated in Fig. 3(b), the spin configuration in the (111) plane indicates that the ordered \( Mn_{3}Ir \) alloy is treated as an unfrustrated antiferromagnet. The

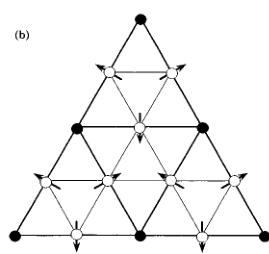
FIG. 4. Temperature dependence of the (100) reflection. Solid lines are Gaussian fits to the peak profiles.

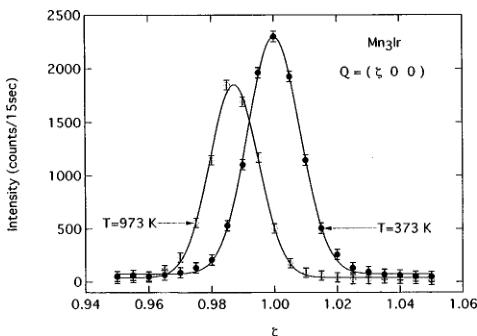
FIG. 5. Temperature dependence of the integrated intensity of the (100) peak for \( Mn_{3}Ir \) . The dashed line is the calculated temperature dependence of the nuclear-scattering part of the (100) reflection due to the Debye–Waller factor.
absence of magnetic diffuse scattering suggests that each Mn moment points exactly along the \( \langle112\rangle \) direction.
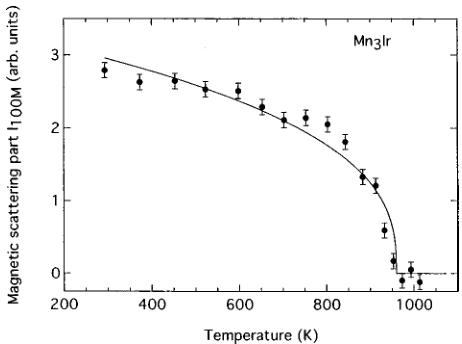
We measured the temperature dependence of the (100) Bragg reflection. Typical data are shown in Fig. 4. Figure 5 plots the integrated intensity of the (100) reflections. The AF phase transition for the ordered alloy occurs at \( T_{N}=960\pm10 \) K, in good agreement with the value determined by susceptibility measurements. \( ^{4} \) The Néel temperature \( T_{N} \) for the corresponding disordered phase is 780 K. \( ^{4} \) The dashed line in Fig. 5 is the calculated temperature dependence of the nuclear-scattering part of the (100) reflection due to Debye–Waller factor, \( ^{10} \) using the Debye temperature \( \Theta=300 \) K for \( Mn_{3}Ir \) . \( ^{11} \) The subtraction of the nuclear-scattering part gives the magnetic part of the integrated intensity of the (100) reflection, \( I_{100M} \) , depicted in Fig. 6. The solid line in Fig. 6 is a least-squares fit to the data with the power law function, \( I_{100M}\propto(1-T/T_{N})^{2\beta} \) using \( \beta=0.17\pm0.01 \) . On the other hand, the intensity of the (110) magnetic reflection for the disordered \( Mn_{0.83}Ir_{0.17} \) alloy, \( I_{110} \) , is found to obey the relationship \( I_{110}\propto(1-T/T_{N})^{2\beta} \) with \( T_{N} \) .

FIG. 6. The magnetic part of the integrated intensity of the (100) reflection in \( Mn_{3}Ir \) , \( I_{100M} \) . The solid curve is a fit to the data with the power law function \( \mathrm{I}_{100\mathrm{M}}^{2\times}(1-T/T_{N})^{2\beta} \) using \( \beta=0.1 \) .

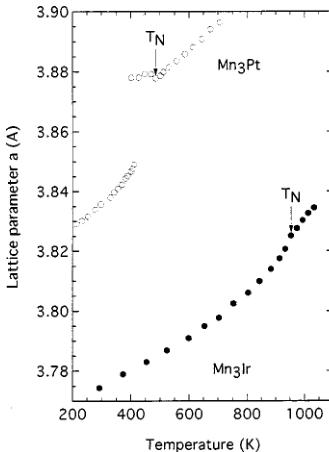
FIG. 7. Temperature dependence of the lattice parameter \(a\) for \(\mathrm{Mn}_{3}\mathrm{Ir}\). For comparison, the \(\mathrm{Mn}_{3}\mathrm{Pt}\) data taken from Yasui et al. (see Ref. 13) is plotted.
=648 K and \( \beta=0.38^{3} \) . The magnetic form factor for the Mn atom is assumed to be temperature independent. The ordered magnetic moment M is then expressed as \( M \propto (1 - T/T_{N})^{\beta} \) . The comparison of the ordered and the disordered alloy results suggests that the ordering in the \( Cu_{3}Au \) structure reduces the temperature dependence of the ordered magnetic moment.
The present \( I_{100M} \) data indicates that the ordered \( Mn_{3}Ir \) maintains the AF triangular spin structure up to \( T_{N} \) ; The AF-AF phase transition is absent in \( Mn_{3}Ir \) . Similar behavior has been observed for \( Mn_{3}Rh \) . \( ^{8} \) The existence of the AF-AF transition is peculiar to \( Mn_{3}Pt \) . \( ^{7} \) The Néel temperatures \( T_{N} \) for the ordered \( Mn_{3}Ir \) , \( Mn_{3}Rh \) , and \( Mn_{3}Pt \) alloys are 960, 853, and 473 K, and the room-temperature lattice parameters \( a_{0} \) are 3.77, 3.81, and 3.83 Å, respectively. \( ^{7,8,12} \) The triangular spin structure requires that the Ir, Rh, and Pt atom should be nonmagnetic. Consequently, an exchange interaction between the nearest-neighbor Mn atoms is dominant in the AF nature of these ordered alloys. The strong exchange interaction in \( Mn_{3}Ir \) is intimately related to the short nearest-neighbor Mn–Mn distance in the (111) plane. Figure 7 shows the temperature dependence of the lattice parameter a extracted from the (100) reflection using a Gaussian fit. For comparison, the \( Mn_{3}Pt \) data reported by Yasui et al. \( ^{13} \) is also plotted. The lattice parameter a for \( Mn_{3}Ir \) changes smoothly in the wide temperature range including \( T_{N} \) . On the other hand, the lattice parameter a for \( Mn_{3}Pt \) shows the 0.75% increase from the low-temperature AF to the high-temperature AF phase transition. \( ^{7,13} \) The lattice parameter data also supports the absence of the AF–AF transition in \( Mn_{3}Ir \) .
On heating to \( T_{N} \) , the lattice parameter a in \( Mn_{3}Ir \) deviates upwards from a linear temperature behavior. The lattice parameter a in the low-temperature AF phase of \( Mn_{3}Pt \) also has the nonlinear temperature dependence. In contrast, the lattice parameters a in the paramagnetic phase of these alloys increase linearly with increasing temperature. The \( Mn_{3}Ir \) result shows that the AF phase transition gives rise to the lattice contraction just below \( T_{N} \) . The x-ray diffraction study on the ordered \( Mn_{3}Pt \) indicates no deviation from cubic symmetry in the low-temperature AF phase. \( ^{13} \) This suggests that the lattice contraction in \( Mn_{3}Ir \) is isotropic.
\( ^{1} \) H. N. Fuke, K. Saito, Y. Kamiguchi, H. Iwasaki, and M. Sahashi, J. Appl. Phys. 81, 4004 (1997).
\( ^{2} \) H. Iwasaki, A. T. Saito, A. Tsutai, and M. Sahashi, IEEE Trans. Magn. 33, 2875 (1997).
\( ^{3} \) T. Yamaoka, M. Mekata, and H. Takaki, J. Phys. Soc. Jpn. 36, 438 (1974). \( ^{4} \) T. Yamaoka, J. Phys. Soc. Jpn. 36, 445 (1974).
\( ^{5} \) P. Gibbs and J. H. Smith, J. Magn. Magn. Mater. 15–18, 155 (1980); N. Cowlman and A. M. Shamah, J. Phys. F 11, 27 (1980).
\( ^{6} \) T. J. Hicks, A. R. Pepper, and J. H. Smith, J. Phys. C 1, 1683 (1968).
\( ^{7} \) E. Krén, G. Kádár, L. Pál, J. Sólyom, P. Szabó, and T. Tarnóczi, Phys. Rev. 171, 574 (1968).
\( ^{8} \) E. Krén, G. Kádár, L. Pál, J, Sólyom, and P. Szabó, Phys. Lett. 20, 331 (1966).
\( ^{9} \) J. S. Kouvel and J. S. Kasper, Proceedings of the International Conference on Magnetism, Nottingham, 1964 (Institute of Physics, London, 1965), p. 165.
\( ^{10} \) H. Lipson, in International Tables for X-ray Crystallography, Vol. II, edited by J. S. Kasper and K. Lonsdale (Kynoch, Birmingham, 1959), pp. 241–265; K. Lonsdale, in International Tables for X-ray Crystallography, Vol. III, edited by C. H. Macgillavry, G. D. Rieck, and K. Lonsdale (Kynoch, Birmingham, 1962), pp. 232–244.
\( ^{11} \) A. Kussmann, K. Muller, and M. Wuttig, Z. Metallkd. 56, 228 (1965).
\( ^{12} \) R. Yamauchi, K. Fukamichi, H. Yamauchi, and A. Sakuma, J. Alloys Compd. 279, 93 (1998).
\( ^{13} \) H. Yasui, M. Ohashi, S. Abe, H. Yoshida, T. Kaneko, Y. Yamaguchi, and T. Suzuki, J. Magn. Magn. Mater. 104–107, 927 (1992).
 p1_0.jpg
 p3_0.jpg
 p3_1.jpg
 p3_2.jpg
 p3_3.jpg
 p4_0.jpg
 p4_1.jpg
 p4_2.jpg
 p4_3.jpg
 p4_4.jpg
 p5_0.jpg