| Experiment Temperature | 295 K |
|---|---|
| Propagation Vector | k1 (0, 0, 0) |
| Parent Space Group | I4/mmm (#139) |
| Magnetic Space Group | Fm'mm (#69.523) |
| Magnetic Point Group | m'mm (8.3.26) |
| Lattice Parameters | 3.32800 3.32800 8.53900 90.00 90.00 90.00 |
|---|---|
| DOI | 10.1103/PhysRevMaterials.8.084413 |
| Reference | Mebatsion S. Gebre, Rebecca K. Banner, Kisung Kang, Kejian Qu, Huibo Cao, Andre Schleife, Daniel P. Shoemaker, PHYSICAL REVIEW MATERIALS (2024) 8 084413 |
| Label | Element | Mx | My | Mz | |M| |
|---|---|---|---|---|---|
| Mn1 | Mn | 3.224 | 3.224 | 0.0 | 4.56 |
Magnetic anisotropy in single-crystalline antiferromagnetic Mn₂Au
Mebatsion S. Gebre \( ^{©} \) , \( ^{1} \) Rebecca K. Banner \( ^{©} \) , \( ^{1,2,3} \) Kisung Kang \( ^{©} \) , \( ^{1} \) Kejian Qu \( ^{©} \) , \( ^{4} \) Huibo Cao \( ^{©} \) , \( ^{5} \) André Schleife \( ^{©} \) , \( ^{1,6} \) and Daniel P. Shoemaker \( ^{©} \)
\( ^{1} \) Department of Materials Science and Engineering and Materials Research Laboratory,
University of Illinois at Urbana-Champaign, Urbana, Illinois 61801, USA
\( ^{2} \) School of Materials Science and Engineering, Georgia Institute of Technology, Atlanta, Georgia 30332, USA
\( ^{3} \) Department of Chemistry, Skidmore College, Saratoga Springs, New York 12866, USA
\( ^{4} \) Department of Physics and Materials Research Laboratory, University of Illinois at Urbana-Champaign, Urbana, Illinois 61801, USA
(Received 15 May 2024; accepted 8 August 2024; published 30 August 2024)
Multiple recent studies have identified the metallic antiferromagnet \( Mn_{2}Au \) to be a candidate for spintronic applications due to apparent in-plane anisotropy, preserved magnetic properties above room temperature, and current-induced Néel vector switching. Crystal growth is complicated by the fact that \( Mn_{2}Au \) melts incongruently. We present a bismuth flux method to grow millimeter-scale bulk single crystals of \( Mn_{2}Au \) in order to examine the intrinsic anisotropic electrical and magnetic properties. Flux quenching experiments reveal that the \( Mn_{2}Au \) crystals precipitate below \( 550\;^{\circ}C \) , about \( 100\;^{\circ}C \) below the decomposition temperature of \( Mn_{2}Au \) . Bulk \( Mn_{2}Au \) crystals have a room-temperature resistivity of \( 16-19\;\mu\Omega\;cm \) and a residual resistivity ratio of 41. \( Mn_{2}Au \) crystals have a dimensionless susceptibility on the order of \( 10^{-4} \) (SI units), comparable to calculated and experimental reports on powder samples. Single-crystal neutron diffraction confirms the in-plane magnetic structure. The tetragonal symmetry of \( Mn_{2}Au \) constrains the ab-plane magnetic susceptibility to be constant, meaning that \( \chi_{100} = \chi_{110} \) in the low-field limit, below any spin-flop transition. We find that three measured magnetic susceptibilities \( \chi_{100} \) , \( \chi_{110} \) , and \( \chi_{001} \) are the same order of magnitude and agree with the calculated prediction, meaning the low-field susceptibility of \( Mn_{2}Au \) is quite isotropic, despite clear differences in ab-plane and ac-plane magnetocrystalline anisotropy. \( Mn_{2}Au \) is calculated to have an extremely high in-plane spin-flop field above 30 T, which is much larger than that of another in-plane antiferromagnet, \( Fe_{2}As \) (less than 1 T). The subtle anisotropy of intrinsic susceptibilities may lead to dominating effects from shape, crystalline texture, strain, and defects in devices that attempt spin readout in \( Mn_{2}Au \) .
DOI: 10.1103/PhysRevMaterials.8.084413
I. INTRODUCTION
Antiferromagnets have compensated, net-zero magnetization but still host a wealth of field- and current-dependent phenomena, notably spin canting in response to an applied field \( [1] \) , spin-flop transitions \( [2–4] \) , and fundamentally higher resonance frequencies than ferromagnets \( [5–7] \) . These terahertz-frequency resonances especially have attracted interest for fast data storage \( [8,9] \) , but questions remain about the exact processes of domain rearrangement and the associated energy scales and barriers \( [10–12] \) . In antiferromagnet-based spintronics, Néel vector switching and anisotropic magnetoresistance (AMR) can potentially be used to write and read data, respectively \( [13–15] \) .
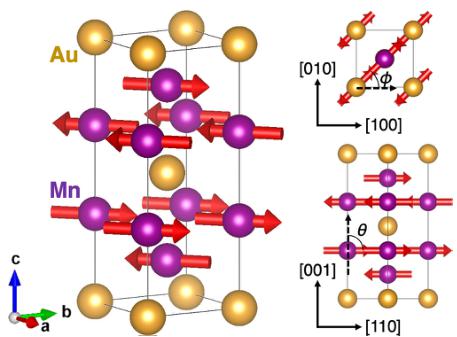
\( Mn_{2}Au \) is one of few room-temperature metallic antiferromagnets, along with CuMnAs and \( Cr_{2}Al \) , that have the crystal symmetry and collinear antiferromagnetic order that allows a staggered (Néel) accumulation of spins in the antiferromagnetic (AFM) sublattices [16,17], which in principle allows the electronic manipulation of the Néel vector using Néel spin-orbit torques [5,15]. \( Mn_{2}Au \) has shown domain orientation by current-induced Néel vector switching [18], though the applied currents are large and the resistance can display a cumulative, sawtooth-shaped pattern rather than binary switching [16]. The unit cell of \( Mn_{2}Au \) is shown in Fig. 1 with arrows on Mn atoms to show this magnetic ordering. Neutron diffraction and magnetization studies on powder \( Mn_{2}Au \) by Barthem et al. confirm the \( k \equiv 0 \) antiferromagnetic structure of \( Mn_{2}Au \) with spins in the ab plane [20]. However, zero-field neutron diffraction of a tetragonal compound does not permit unique identification of the easy axis within the ab plane. The powder study also showed an approximate susceptibility of \( 5 \times 10^{-4} \) averaged over all crystal directions. Neutron data showed a Mn moment of about \( 4\mu_{B} \) , which is retained to about 85% of its base value at 900 K [20]. \( Mn_{2}Au \) thus maintains its magnetic ordering until it decomposes upon heating into MnAu and an fcc solid solution phase, with a Néel temperature theorized up to 1300–1600 K [20,21]. The presence of gold in \( Mn_{2}Au \) should also lead to a significant contribution from spin-orbit coupling [22]. This high thermal stability is a hallmark of strong exchange interactions and anisotropy, and makes the material ideal for fundamental studies at room temperature or future data storage applications [16], but no bulk crystal growth has been reported to date.

FIG. 1. Crystal structure of tetragonal \( Mn_{2}Au \) ( \( 14/mmm \) , \( a = 3.33 \AA \) , \( c = 8.54 \AA \) ) showing the antiferromagnetic ordering with magnetic moments along [110], the assumed easy axis from Sapozhnik et al. [19]. The right-hand side displays the (001) plane and the (110) plane, while the angles \( \theta \) and \( \phi \) represent the angles utilized in our calculation of magnetocrystalline anisotropy.
Several studies of thin films and polycrystals have examined the magnetic and electrical properties of \( Mn_{2}Au \) [16,19,20]. Thin-film X-ray magnetic linear dichroism photoemission electron microscopy (XMLD-PEEM) studies by Sapozhnik et al. found a magnetic easy axis of \( \langle110\rangle \) and calculated an in-plane anisotropy term in the range 1–17 \( \mu \) eV/f.u., corresponding to lower and upper limits for the predicted spin-flop fields \( H_{SF} \) of 7–30 T [19]. While the upper limit of 17 \( \mu \) eV/f.u. is evidenced by domain growth from \( \approx1 \) \( \mu \) m along the equivalent [110] and [1 \( \bar{1} \) 0] easy axes at zero field to several microns perpendicular to the field at an applied field of 30 T, the lower limit was determined using domain wall widths near the resolution of the images. Two studies by Bodnar et al. [14,16] showed evidence of current-induced and magnetic-field-induced Néel vector switching in \( Mn_{2}Au \) thin films separately. They also demonstrated AMR with a field along the hard \( \langle100\rangle \) direction to be 6%, which is much larger than that along the easy \( \langle110\rangle \) crystal direction of -0.15%. The apparent switching behavior in magnetoresistance along \( \langle110\rangle \) and \( \langle100\rangle \) directions was discussed to be consistent with an extremely small or negligible in-plane anisotropy. This is consistent with an in-plane magnetocrystalline anisotropy energy (MAE) constant of 10 \( \mu \) eV/f.u. calculated by Shick et al. [21]. The effects of strain and defects are also apparent in a recent XMLD-PEEM study of patterned CuMnAs and \( Mn_{2}Au \) [23].
While most recent work has focused on \( Mn_{2}Au \) thin films, the fundamental properties of the material remain to be seen in bulk crystal form. Notably, anisotropy may be strongly influenced by large stresses in epitaxial films and texturing from high applied currents. In order to fully understand the material properties of \( Mn_{2}Au \) , we sought to synthesize and characterize bulk single crystals. According to the Mn-Au phase diagram, \( Mn_{2}Au \) decomposes into solid MnAu and Mn phases at \( 680^{\circ}C \) before melting [24]. This makes single-crystal growth by directly cooling from the melt unfeasible. To grow a bulk single crystal, a flux method can be used to

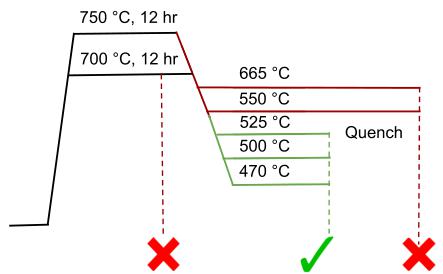
FIG. 2. Quenching experiments performed at a range of temperatures are summarized along with the respective phases formed. MnAu formation is represented by the red ×, and \( Mn_{2}Au \) formation is represented by the green check.
precipitate Mn and Au at lower temperatures. Considering its binary phase diagrams with Au and Mn each, Bi was the most logical flux candidate \( [25,26] \) . Here we describe the flux synthesis and physical characterization of the obtained crystals.
II. METHODS
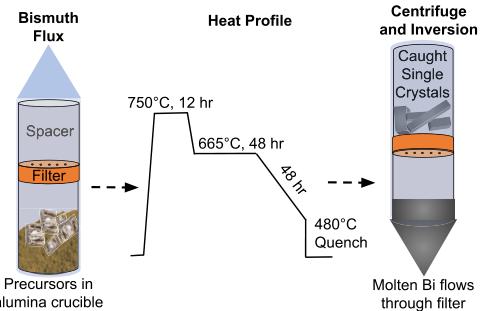
Synthesis was performed using solid-state methods and metal flux techniques. As-received Mn pieces with oxidetarnished surfaces were cleaned by heating in vacuum at \( 1000^{\circ} \) C for 12 hours, after which the Mn pieces are bright silver and the inner walls of the tube are dark. Flux growth of \( Mn_{2}Au \) crystals was conducted using elemental precursors of Mn granules (99.98%, 0.8–12 mm), Au powder (99.99%, 100 mesh), and Bi chunks (99.99%, \( \leqslant \) 15 mm) with an optimized nominal molar ratio of \( Mn:Au:Bi = 7:1:12 \) . The precursors were loaded into alumina crucibles, topped by alumina fritted disks [27] and a glass rod spacer in a fused silica ampoule. This setup, prepared in an argon-filled glovebox, was then evacuated and sealed at about 50 mTorr of pressure for reaction in an inert environment. The precursors were heated to a maximum temperature of \( 750^{\circ} \) C for 12 hours, quickly cooled and held at \( 650^{\circ} \) C for up to 24 hours below the dissociation temperature of \( Mn_{2}Au \) , slowly cooled to \( 470–480^{\circ} \) C for crystal growth, and from this temperature inverted and centrifuged to remove excess flux. Variations of this recipe used to determine the precipitation temperature of the \( Mn_{2}Au \) phase and to optimize relative nominal amounts of precursors are summarized in Fig. 2 and tabulated in the Supplemental Material, Table S1 [28], along with a list of the largest crystal sizes obtained from each reaction. The synthesis is shown schematically in Fig. 3. \( Mn_{2}Au \) single crystals were manually isolated from remnant Bi flux by mechanically scraping or cleaving samples to isolate clean parts. Where remnant flux could not be easily removed mechanically, samples were acid etched with a 2:1 ratio of \( HNO_{3} \) and HCl for less than 2 min.
Powder x-ray diffraction (XRD) was conducted in transmission geometry with a Bruker D8 diffractometer with Mo Kα radiation. Reflection x-ray diffraction was performed with a Bruker D8 diffractometer with Cu Kα radiation on

FIG. 3. Schematic of \( Mn_{2}Au \) flux crystal growth. Elemental precursors are loaded in an alumina crucible. The arrangement in a vacuum-sealed quartz ampoule allows the excess flux to be removed by decanting while crystals are caught by a fritted disk.
single-crystalline samples to confirm crystal orientation. Rietveld analysis was performed using GSAS-II [29].
Microstructure and composition were assessed using a ThermoFisher Axia ChemiSEM scanning electron microscope with electron dispersive x-ray spectroscopy (SEM-EDS) using an acceleration voltage of 20 kV. A Shimadzu differential thermal analyzer (DTA-50) was used to examine the thermal stability of the flux-synthesized \( Mn_{2}Au \) single crystals between room temperature and \( 750^{\circ}C \) , with samples in sealed quartz ampoules. Electron backscatter diffraction (EBSD) mapping was conducted in a Thermo Scios2 Dual-Beam SEM instrument at an acceleration voltage of 30 kV. Magnetic susceptibility measurements were performed using a Quantum Design Magnetic Property Measurement System (MPMS). Four-point resistivity measurements were made using a Quantum Design Physical Property Measurement System (PPMS).
Single-crystal neutron diffraction was collected on a \( 1 \times 0.1 \times 0.1 \, mm^{3} \) \( Mn_{2}Au \) crystal on the HB-3A four-circle diffractometer at the High Flux Isotope Reactor (HFIR) at Oak Ridge National Laboratory. A neutron wavelength of \( 1.542 \, A \) was used and measurements were conducted at 295 K. Magnetic symmetry analysis was done using the MAXMAGN tool in the Bilbao Crystallographic Server [30]. Single-crystal neutron diffraction refinements of the nuclear and magnetic structure were done using the FULLPROF suite [31].
First-principles density functional theory (DFT) simulations were carried out using the Vienna Ab Initio Simulation Package (VASP), employing the projector-augmented-wave (PAW) formalism \( [32,33] \) to describe the electron-ion interaction. Kohn-Sham states were expanded into plane waves with a cutoff energy of 600 eV. The exchange-correlation term in the Kohn-Sham equation was described using the Perdew-Burke-Ernzerhof (PBE) formulation of the generalized gradient approximation \( [34] \) . We also used the DFT + U approach \( [35] \) and selected an effective on-site Coulomb interaction parameter \( U_{eff} = 1.4 \, eV \) , resulting in good agreement between lattice parameters from our experiment and those from another x-ray diffraction experiment \( [36] \) (for details see Fig. S10 in the Supplemental Material \( [28] \) ). The measured magnetic moments from powder samples \( [20] \) further substantiate the suitability of our choice of the \( U_{eff} \) value. However, the magnetic moments derived from this work are about \( 0.5\mu_{B} \) larger (see Fig. S10 in the Supplemental Material \( [28] \) ). For a reliable representation of the in-plane and out-of-plane magnetocrystalline anisotropy energy, a Monkhorst-Pack k-point mesh \( [37] \) of \( 24 \times 24 \times 9 \) was meticulously chosen, as depicted in Fig. S8 of the Supplemental Material \( [28] \) . We ensure k-point convergence of the anisotropic energy difference within \( 540 \, kJ/m^{3} \) for \( K_{1} \) and \( 5 \, kJ/m^{3} \) for \( K_{22} \) . The influence of spin-orbit coupling is included within the noncollinear magnetism framework by applying a non-self-consistent field (SCF) calculation for the spin-orbit coupling effect after a spin-polarized SCF calculation \( [38] \) . Atomic geometries are relaxed using the SCF spin-polarized approach only, i.e., without spin-orbit coupling. In all cases, the magnetic structure was included in the description. In the calculation of the magnetic susceptibility, we enforced the angular constraint on the magnetic moments using a penalty term in the total energy, as implemented in VASP.
III. RESULTS AND DISCUSSION
Bulk single crystals of \( Mn_{2}Au \) , with dimensions on the millimeter scale, were grown using Bi flux. The decomposition temperature of \( Mn_{2}Au \) in the solid state is reported to be \( 680^{\circ}C \) [39]. In bismuth flux, our quenching experiments, summarized in Fig. 2, reveal that \( Mn_{2}Au \) precipitated from flux below \( 550^{\circ}C \) , while MnAu formed between 550 and \( 700^{\circ}C \) .
Differential thermal analysis (DTA) of isolated \( Mn_{2}Au \) crystals was used to assess the dissociation temperature compared to the existing Mn-Au phase diagram [40]. The DTA signal for pure \( Mn_{2}Au \) crystals (see Fig. S3 in the Supplemental Material [28]) shows phase changes with onset at \( \sim680^{\circ}C \) on heating and \( \sim630^{\circ}C \) on cooling. This sets the upper temperature bound for applications using \( Mn_{2}Au \) , as heating a spintronic device past \( 630^{\circ}C \) could destroy the Mn/Au ordering.
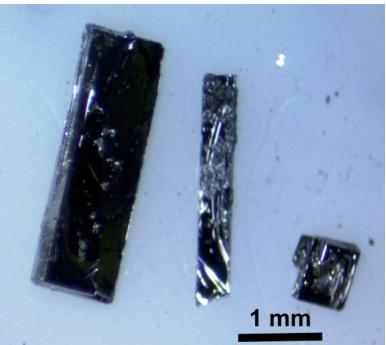
In order to find optimal heating and composition protocols, many samples were prepared under varying conditions such as the nominal amounts of Mn:Bi and the heating profile. A variety of crystal shapes were obtained, as shown in Fig. 4, including cubes, thick needles, and flat plates on the millimeter scale. There may be some significance of specific heating steps that were attempted: As an example, a hold at \( 650^{\circ} \) C seems to favor a smaller quantity of larger single crystals, and larger Mn:Bi ratios favor platelike morphology over thin needles. However, a mechanistic understanding of these steps remains to be fully developed due to the complexity of the process. Variations of flux syntheses are tabulated in the Supplemental Material [28]. The largest crystals at optimized conditions were used for further characterization.
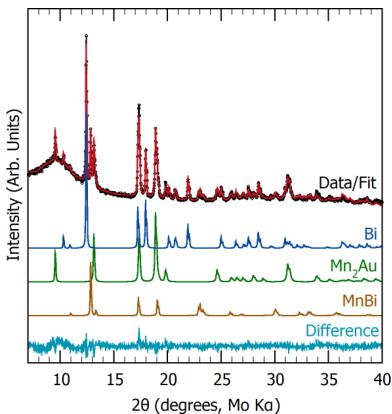
Rietveld refinement of powder XRD for Bi-flux products caught after centrifuging is presented in Fig. 5. The refinement shows 58 mol % \( Mn_{2}Au \) , 20 mol % Bi, and 22 mol % MnBi. This distribution indicates that the \( Mn_{2}Au \) single crystals have residual MnBi and Bi on their surfaces. The \( Mn_{2}Au \) single crystals used for further characterizations were picked out and

FIG. 4. Optical micrograph of representative \( Mn_{2}Au \) bulk crystals with plate, needle, and square morphologies.
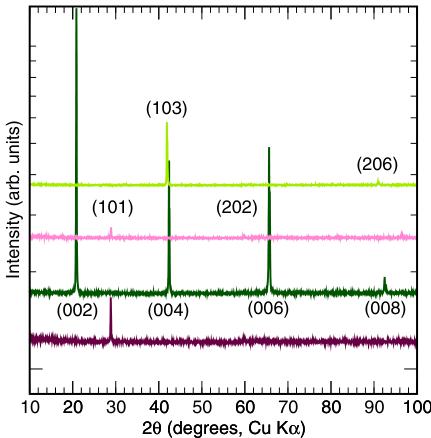
cleaned mechanically. However, a small amount of Bi and MnBi typically remains on the surface, which is subsequently removed (to the best of our ability) by etching as described in Sec. II. This phase distribution in the reaction products is visually apparent in SEM-EDS images shown in Fig. S1 of the Supplemental Material [28]. Reflection XRD (see Fig. 6) is used as a preliminary tool to check the orientation of \( Mn_{2}Au \) single crystals. The diffraction data in green are obtained for platelike crystals, showing that the (001) plane is the largest exposed plane. The data in pink were obtained for crystals with horizontally lying needlelike crystal formation; the reflections correspond to \( \langle h0l\rangle \) . The large plates have the c axis pointing perpendicular to the widest exposed plane while the narrow needles have the c axis lying in the plane perpendicular to the longest sample dimension.

FIG. 5. Powder XRD and Rietveld-refined contribution of a typical Bi-flux growth that yields the desired \( Mn_{2}Au \) phase along with Bi and MnBi impurities. Bi and MnBi are removed prior to magnetic characterization, as described below.

FIG. 6. Reflection XRD of representative \( Mn_{2}Au \) crystals with different morphologies. Light and dark pink curves are data from needlelike samples where the direction normal to the long needle axis is shown to have (101) character. Light and dark green curves are data collected from the large exposed faces of platelike samples. The light green sample shows an oblique (103) orientation, while the dark green curve shows that the c axis points out of the face. This (001) face orientation is the most commonly observed orientation of flat crystals.
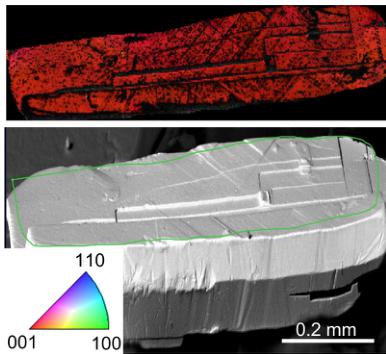
EBSD maps as in Fig. 7 were used to confirm the orientation of millimeter-scale platelike \( Mn_{2}Au \) crystals. The map shows that the c axis of the crystal is perpendicular to the largest exposed sample plane. The inverse pole figure shows that the entire face is red, corresponding to [001] orientation. Since EBSD is quite surface sensitive, crystal facets and steps with different orientations appear dark as their

FIG. 7. Electron backscatter diffraction (EBSD) map (top) and corresponding electron micrograph (bottom) confirm that the \( Mn_{2}Au \) c axis is normal to the large flat crystal face. An inset shows the inverse pole figure key where red corresponds to the (001) lattice plane.

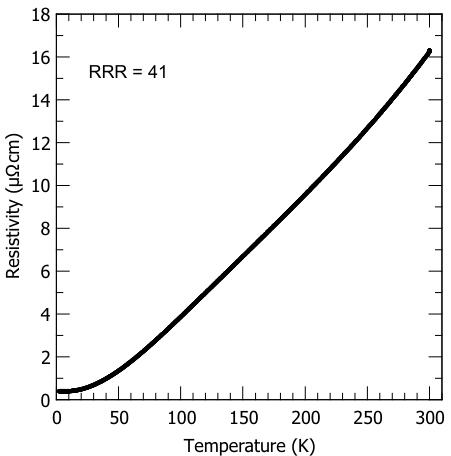
FIG. 8. Four-point resistivity of a bulk single crystal of \( Mn_{2}Au \) along \( \langle100\rangle \) shows metallic behavior with a residual resistivity ratio (RRR) of 41.
Kikuchi patterns are not well recorded. The EBSD data also offer three-dimensional information of orientation within the surface plane. The vector difference between two points along the longest dimension (horizontal in Fig. 7) corresponds to the [100] crystal direction. Accordingly, the diagonal dark lines with [110] orientation are growth terraces. Anisotropic magnetic and transport measurements on this and other \( Mn_{2}Au \) crystals were performed after confirming the orientation of each with XRD and EBSD.
Four-point resistivity measurements with current applied along the length of a needlelike crystal along \( \langle100\rangle \) confirm the metallic behavior of \( Mn_{2}Au \) with a room-temperature resistivity of \( \sim16\ \mu\Omega\ cm \) (see Fig. 8) and a low temperature (2 K) resistivity of \( \sim0.4\ \mu\Omega\ cm \) . This compares to resistivity of \( \sim21 \) and \( \sim7\ \mu\Omega\ cm \) reported for an epitaxial film at 300 and 2 K, respectively [13]. The residual resistivity ratio (RRR) of 41 in our bulk sample is an order of magnitude larger than that reported for epitaxial films [13] because of the small low-temperature resistivity in the bulk sample.
Similar four-point resistivity measurements along other crystal directions are limited by the sample’s aspect ratio. We attempted to conduct measurements of micron-scale lamellae by focused ion beam liftout, but a high concentration of implanted Ga led to a drastic decrease in the RRR.
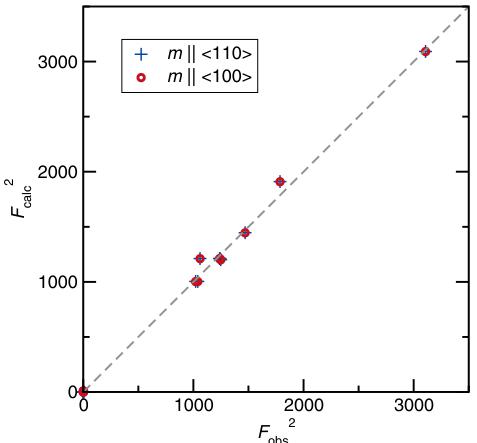
Single-crystal neutron diffraction data refinements (see Fig. 9) show excellent agreement between calculated and observed structure factors for antiferromagnetic tetragonal \( Mn_{2}Au \) with a propagation vector \( k = [000] \) . Refinements were carried out using two different magnetic space groups corresponding to the two possible Néel vectors within the ab plane for the commensurate antiferromagnetic (AFM) phase in the nuclear \( I4/mmm \) space group. The \( Fm'mm \) magnetic space group (No. 69.523) was used to refine the AFM phase with a Néel vector along \( \langle110\rangle \) . The \( Im'mm \) magnetic

FIG. 9. Calculated versus observed structure factors for a phase of \( Mn_{2}Au \) that includes both magnetic and nuclear contributions are obtained from single-crystal neutron diffraction. Two models with Néel vectors along the \( \langle110\rangle \) and \( \langle100\rangle \) family of directions confirm in-plane moments but give equivalent fits that cannot reveal the in-plane moment direction. That direction is determined by magnetic susceptibility measurements.
space group (No. 71.535) was used to refine that with the Néel vector along \( \langle100\rangle \) . Both refinements converge to a Mn moment of \( 4.56(2)\mu_{B} \) , which is slightly larger than the DFT-obtained value of \( 3.98\mu_{B} \) and the one measured on powder samples of \( 4\mu_{B} \) [20]. Visually, it is apparent from Fig. 9 that both models describe the experimental data equally well. Both fits give \( R_{F}=0.019 \) and \( \chi^{2}=0.26 \) , due to the symmetry equivalence of the two in-plane models for single-crystal neutron scattering. Since the easy axis cannot be distinguished between \( \langle110\rangle \) and \( \langle100\rangle \) , a complementary confirmation of in-plane anisotropy is presented using the directional magnetic property measurements that follow.
Magnetization isotherms and temperature sweeps were used to characterize the magnetic response of samples over a large span of temperatures between 10 and 700 K, but careful experimentation is required to separate the intrinsic response of \( Mn_{2}Au \) from dilute MnBi impurities. Magnetization isotherms at 300 and 700 K, as well as intermediate magnetization versus temperature scans, discussed in detail in the Supplemental Material [28], revealed that amounts as low as 2 mol % of the MnBi low-temperature phase (LTP) dominate the magnetic response. LTP MnBi orders ferromagnetically at 630 K [41], concurrent with its phase change to the high-temperature phase (HTP). Room-temperature scans are easily overwhelmed by the ferromagnetic contribution from the MnBi impurity exhibiting a large magnetization M, a nonlinear saturation of M, and hysteresis. Above the ordering temperature of LTP MnBi, however, M is linear with applied field H with a susceptibility on the order of \( 10^{-4} \) as expected for \( Mn_{2}Au \) [20]. The disappearance of ferromagnetic behavior above the Curie temperature of the MnBi impurity confirms

FIG. 10. Magnetization isotherms at 10 and 300 K with field applied along the \( \langle110\rangle \) and \( \langle100\rangle \) crystal directions show evidence of in-plane anisotropy. Susceptibilities extracted from the data with H > 1T are listed. The ratios of \( \chi_{110}/\chi_{100} \) are 1.5 and 1.2, similar to \( \sqrt{2} \) .
that the ferromagnetism observed at room temperature is not an intrinsic property of the \( Mn_{2}Au \) sample itself, but rather of the MnBi impurity.
To obtain anisotropic susceptibility of the single crystals, this large ferromagnetic (FM) contribution had to be reduced further. Reducing the ferromagnetic signal at room temperature, without having to break clean sections of samples, was explored via two ways. In the first approach, inspired by high-temperature magnetization measurements, a sample was heated to 700 K in vacuum and quenched quickly to avoid reformation of the LTP MnBi. In the second approach, the \( Mn_{2}Au \) crystals were etched with a 1:2 HCl and \( HNO_{3} \) solution for 2 min to remove the Bi flux. Whereas both helped reduce the FM contribution, they brought the risk of oxidizing the sample or leaching the Mn from the sample. Further details on these methods are discussed in the Supplemental Material [28] and Refs. [42–46] within.
The cleanest \( Mn_{2}Au \) samples were obtained by manually cutting the flux-free sections of as-synthesized single crystals. Magnetic isotherms measured on this sample at 10 and 300 K with the field along \( \langle110\rangle \) and \( \langle100\rangle \) are shown in Fig. 10. A mostly linear behavior in M with field H is observed for all measurements with the exception of a steeper region between \( \pm0.1 \) T. While the behavior near H = 0 T may be due to trace amounts of MnBi, the predominantly linear behavior at higher fields represents the intrinsic \( Mn_{2}Au \) susceptibility. The dimensionless susceptibility \( \chi \) is calculated using the slope of this linear section of the data for applied fields H > 0.1 T. The susceptibility in each case is on the order of \( 10^{-4} \) , matching the calculated value of \( 3.98 \times 10^{-4} \) for \( Mn_{2}Au \) in the literature [47]. The in-plane diagonal susceptibility \( \chi_{110} \) is larger than \( \chi_{100} \) by factors 1.5 and 1.25 at 10 and 300 K, respectively. Different samples, acid-cleaned by different methods, consistently showed that \( \chi_{110} > \chi_{100} \) , as discussed in the Supplemental Material [28]. No subtle features that would indicate a polarization of in-plane domains or a spin-flop field are apparent in the linear regions of susceptibility for \( Mn_{2}Au \) , unlike those observed in the more susceptible in-plane antiferromagnet \( Fe_{2}As \) [48]. As we discuss below, the in-plane spin-flop field is predicted to be greater than 30 T.
The magnetic susceptibility measurements in Fig. 10 complement our neutron diffraction data by probing the in-plane Néel direction. \( Mn_{2}Au \) is antiferromagnetic at both temperatures, 300 and 10 K, and the susceptibility measurements show that the in-plane susceptibilities are approximately equal at room temperature, with a small anisotropy at 10 K. These susceptibilities are very small, on the same order as the isostructural room-temperature antiferromagnet \( Cr_{2}Al \) [17], and about 100 times smaller than \( Fe_{2}As \) [48]. The susceptibility along the c axis, \( \chi_{001} \) , is about \( 4.9 \times 10^{-4} \) , on the same order of magnitude as \( \chi_{100} \) and \( \chi_{110} \) (shown in Supplemental Material Fig. S7 [28]). For a tetragonal crystal, the low-field (below spin-flop) in-plane susceptibility should be isotropic; there are only \( \chi_{11} \) , \( \chi_{33} \) , and \( \chi_{13} \) terms in the susceptibility (as discussed in the Supplemental Material [28] and in the texts by Nye [49] and Newnham [50]), so the measured difference we see between \( \chi_{100} \) and \( \chi_{110} \) is likely due to shape anisotropy of the \( Mn_{2}Au \) or texturing of minuscule amounts of ferromagnetic MnBi impurity (discussed in detail in the Supplemental Material [28]). The \( \langle110\rangle \) direction was proposed to be the easy axis by thin-film studies employing XMLD-PEEM for direct domain imaging [19]. The thin-film study shows easy-axis domain growth when fields above 30 T are applied perpendicular to \( \langle110\rangle \) .
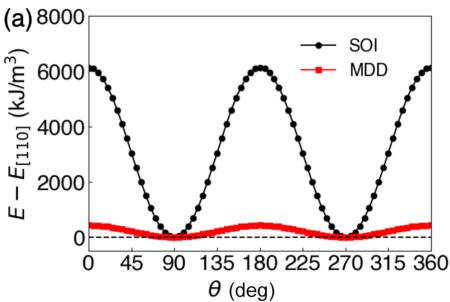
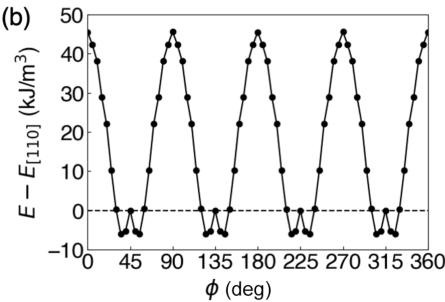
To gain a deeper understanding of this anisotropy, we employed first-principles density functional theory to investigate the MAE of \( Mn_{2}Au \) . In Fig. 11, we present the MAE results for Néel vector orientations that include c components [out of the (001) plane, which are unfavorable], and orientations within the easy (001) plane. Energies are plotted as a function of angles \( \theta \) and \( \phi \) deviating from the c axis and a axis, respectively (see Fig. 1). Visually, it is clear that in-plane spin configurations are preferred, while the in-plane angular dependence is comparatively weak. The origin of the MAE in \( Mn_{2}Au \) can be attributed to the spin-orbit interaction (SOI), which plays a more significant role than the magnetic dipole-dipole (MDD) interaction.
The MAE coefficients were determined by fitting the calculated data from Fig. 11 to
\[ \frac{E_{\mathrm{MAE}}}{V}=K_{1}\sin^{2}\theta+K_{2}\sin^{4}\theta+K_{22}\sin^{4}\theta\cos(4\phi). \quad (1) \]
From this we obtain the total in-plane coefficient \( K_{1}^{tot} = 6574 \, kJ/m^3 = 1978.3 \, \mu eV/f.u. \) and the total out-of-plane coefficient \( K_{22}^{tot} = 26 \, kJ/m^3 = 7.89 \, \mu eV/f.u. \) . These MAE values are one or two orders of magnitude larger than for the metallic antiferromagnets \( Fe_2As \) [48] and \( Cr_2Al \) [17]. Both SOI and MDD interactions contribute to the MAE, and their respective contributions to the in-plane and out-of-plane MAE coefficients are as follows: \( K_1^{SOI} = 6144 \, kJ/m^3 = 1849.0 \, \mu eV/f.u. \) , \( K_1^{MDD} = 430 \, kJ/m^3 = 129.3 \, \mu eV/f.u. \)


FIG. 11. Magnetocrystalline anisotropy of \( Mn_{2}Au \) from DFT calculations shows that (a) in the (110) plane, minimum energy \( (E=0) \) occurs when the spins point along \( \langle1\bar{1}0\rangle \) , which confirms that (001) is the easy plane. \( \theta \) and \( \phi \) are defined as the angles from the c axis and the a axis, respectively (see Fig. 1). (b) Magnetocrystalline anisotropy within the (001) plane shows that E is minimized near \( \phi=45^{\circ} \) , which is the \( \langle110\rangle \) direction. The two separate contributions from spin-orbit interaction (SOI) and magnetic dipole-dipole (MDD) interactions are shown in (a), while the in-plane MDD is symmetry forbidden in (b).
\( K_{22}^{SO1}=26\ kJ/m^{3}=7.89\ \mu eV/f.u. \) , and \( K_{22}^{MDD}=0\ kJ/m^{3} \) . The magnitude of \( K_{1}^{MDD} \) is comparable to that of \( Fe_{2}As \) [48] and \( Cr_{2}Al \) [17]. However, the absence of \( K_{2}^{MDD} \) is solely due to magnetic symmetry in the (001) plane. On the other hand, the presence of the heavy element Au in \( Mn_{2}Au \) significantly enhances the spin-orbit coupling effect, resulting in remarkably large values for both \( K_{1}^{SO1} \) and \( K_{22}^{SO1} \) , about 20 and 100 times larger than \( K_{1}^{SO1} \) and \( K_{22}^{SOI} \) of \( Fe_{2}As \) [48]. The positive sign of \( K_{1} \) indicates easy-plane magnetism, while the positive sign of \( K_{22} \) signifies an easy axis along \( \langle110\rangle \) . We observe a small energy bump near \( \langle110\rangle \) in the in-plane MAE. This bump appears to be a higher-order feature that persists even when the number of k points in the calculation is increased, as illustrated in Fig. S9 of the Supplemental Material [28].
Using the energy surface method \( [47,51] \) and a first-principles approach, we further investigated the anisotropic magnetic susceptibility of \( Mn_{2}Au \) , revealing subtle variations among different orientations. This method assumes a single-crystalline structure with a single domain, where the Néel vector orientation is aligned perpendicular to the external magnetic field beyond the spin-flop field \( [47,51] \) . We believe that this is well justified because with only one symmetrical magnetic site \( Mn_{2}Au \) has a much simpler magnetic structure than \( Fe_{2}As \) which we studied before \( [48] \) . Consequently, this approach allows us to determine the anisotropic magnetic susceptibility during the occurrence of a spin-flop transition. Since \( Mn_{2}Au \) possesses only one symmetrical magnetic site, we only need to calculate the energy curve while varying net magnetization corresponding to the tilting angle of the magnetic moment on the Mn atom, as illustrated in Fig. S11 of the Supplemental Material \( [28] \) . The curvature a of these curves is associated with the perpendicular magnetic susceptibility \( \chi_{\perp} \) , as described by \( [51] \)
\[ \chi_{\perp}=\frac{\mu_{0}}{2a-\mu_{0}}, \quad (2) \]
where \( \mu_{0} \) is the vacuum permeability.
Our calculations yield values of \( \chi_{\perp}^{[100]}=4.27\times10^{-4} \) , \( \chi_{\perp}^{[110]}=4.11\times10^{-4} \) , and \( \chi_{\perp}^{[001]}=4.10\times10^{-4} \) for the anisotropic magnetic susceptibility in the regime with a single in-plane magnetic domain (e.g., above a spin-flop transition). The value of \( \chi_{\perp}^{[001]} \) does not change in the single- or multidomain case (above or below spin flop, low or high field) for \( Mn_{2}Au \) since spins remain normal to the c axis, and the obtained experimental value of \( 4.9\times10^{-4} \) (Supplemental Material Fig. S7) is in very good agreement [28]. We estimate an error bar due to k-point convergence of about \( 0.6\times10^{-4} \) for these values, which is low enough to reliably conclude a very small anisotropy of the susceptibility. The subtle differences in our simulated values are consistent with a relatively weak influence of magnetocrystalline anisotropy (MCA), which is on the order of kilojoules to megajoules per cubic meter (see Fig. 11). The susceptibility is instead dominated by exchange interactions that exhibit a much larger magnitude on the order of gigajoules per cubic meter (see Fig. S10 of the Supplemental Material [28]). Because of this difference in order of magnitude, any anisotropic contribution from MCA is not visible in the susceptibility above the spin-flop field. As we discuss next, the magnetic field used to measure susceptibility in this work is clearly below the spin-flop transition. In this regime, the susceptibility can be anisotropic (consistent with Fig. 10) and, in addition, can be influenced by domain effects or magnetic defects.
Finally, we note that the out-of-plane and in-plane spin-flop fields can be determined using [52]
\[ H_{\mathrm{SF}}^{\mathrm{out}}=\sqrt{\frac{2K_{\mathrm{I}}}{\chi_{\perp}-\chi_{\mathrm{I}}}}, \quad (3) \]
\[ H_{\mathrm{SF}}^{\mathrm{in}}=\sqrt{\frac{16K_{22}}{\chi_{\perp}-\chi_{\parallel}}}. \quad (4) \]
By using the DFT-calculated anisotropy coefficients and magnetic susceptibility values at 0 K with an assumption of \( \chi_{\parallel}=0 \) , we obtain the spin-flop fields of \( H_{SF}^{out}=201~T \) and \( H_{SF}^{in}=36~T \) , respectively. These results agree with our lack of observation of an in-plane spin flop up to 7 T, and the small amount of domain orientation at 30 T observed in thin films [19]. The out-of-plane spin-flop transition would not be observed experimentally in \( Mn_{2}Au \) , since it would always be more stable for the spins to point along the basal plane direction.
normal to the field. Higher-field magnetization experiments on bulk \( Mn_{2}Au \) could confirm the in-plane prediction.
IV. CONCLUSIONS
In summary, we report the bulk single-crystal growth and anisotropic characterization of the metallic antiferromagnet \( Mn_{2}Au \) in Bi flux. Four-point resistivity measurements on bulk single crystals confirm the metallic transport behavior with RRR = 41 attesting to the low defect concentration in the crystals. Single-crystal neutron diffraction analysis agrees with an easy ab plane, while the orientation within the plane cannot be determined by low-field susceptibility or neutron scattering measurements due to tetragonal symmetry. The comparison between experiment and theory for the magnetic arrangement, Mn moment size, and overall susceptibility is consistent. The computational result indicates an easy axis along \( \langle110\rangle \) , in agreement with prior experiments on thin films. Rigorous convergence testing and multiple experimental trials confirm both results. Further investigation is necessary to determine if there are additional subtle effects that affect the Néel vector orientation in experimental and computational results, since the anisotropy is small and could be influenced by strain from substrates, surface features, or defects. High-field magnetometry and torque magnetometry are additional plausible next steps. The absence of evidence of an easy-plane spin-flop transition within the range of magnetic measurements up to 7 T is corroborated by computational prediction of the spin-flop field to be 36 T. The high spin-flop fields are likely to be increased by defects and applied strains.
[1] T. Moriya, Phys. Rev. 120, 91 (1960).
[2] V. Baltz, A. Manchon, M. Tsoi, T. Moriyama, T. Ono, and Y. Tserkovnyak, Rev. Mod. Phys. 90, 015005 (2018).
[3] A. N. Bogdanov, A. V. Zhuravlev, and U. K. Rößler, Phys. Rev. B 75, 094425 (2007).
[4] R. L. Carlin and A. J. Van Duyneveldt, Acc. Chem. Res. 13, 231 (1980).
[5] S. A. Siddiqui, J. Sklenar, K. Kang, M. J. Gilbert, A. Schleife, N. Mason, and A. Hoffmann, J. Appl. Phys. 128, 040904 (2020).
[6] S. Wienholdt, D. Hinzke, and U. Nowak, Phys. Rev. Lett. 108, 247207 (2012).
[7] K. Olejnič, T. Seifert, Z. Kašpar, V. Novák, P. Wadley, R. P. Campion, M. Baumgartner, P. Gambardella, P. Němec, J. Wunderlich, J. Sinova, P. Kužel, M. Müller, T. Kampfrath, and T. Jungwirth, Sci. Adv. 4, eaar3566 (2018).
[8] S. M. Rezende, A. Azevedo, and R. L. Rodríguez-Suárez, J. Appl. Phys. 126, 151101 (2019).
[9] R. Khymyn, I. Lisenkov, V. Tiberkevich, B. A. Ivanov, and A. Slavin, Sci. Rep. 7, 43705 (2017).
[10] M. Meinert, D. Graulich, and T. Matalla-Wagner, Phys. Rev. Appl. 9, 064040 (2018).
[11] K. Olejnič, V. Schuler, X. Marti, V. Novák, Z. Kašpar, P. Wadley, R. P. Campion, K. W. Edmonds, B. L. Gallagher, J. Garces, M. Baumgartner, P. Gambardella, and T. Jungwirth, Nat. Commun. 8, 15434 (2017).
and, together with the rather isotropic magnetic susceptibility (even along the c axis), pose a unique challenge to fundamental and applied studies that seek to control antiferromagnetic domain structures in predictable ways.
ACKNOWLEDGMENTS
This work was undertaken as part of the Illinois Materials Research Science and Engineering Center, supported by the National Science Foundation MRSEC program under NSF Award No. DMR-1720633. The characterization was carried out in part in the Materials Research Laboratory Central Research Facilities, University of Illinois. Single-crystal neutron diffraction was conducted at ORNL's High Flux Isotope Reactor, sponsored by the Scientific User Facilities Division, Office of Basic Energy Sciences, U.S. Department of Energy. This work made use of the Illinois Campus Cluster, a computing resource that is operated by the Illinois Campus Cluster Program (ICCP) in conjunction with the National Center for Supercomputing Applications (NCSA) and which is supported by funds from the University of Illinois at Urbana-Champaign. This research is part of the Blue Waters sustained-petascale computing project, which is supported by the National Science Foundation (Awards No. OCI-0725070 and No. ACI-1238993) and the state of Illinois. Blue Waters is a joint effort of the University of Illinois at Urbana-Champaign and its National Center for Supercomputing Applications.
[12] M. B. Jungfleisch, W. Zhang, and A. Hoffmann, Phys. Lett. A 382, 865 (2018).
[13] M. Jourdan, H. Bräuning, A. Sapozhnik, H.-J. Elmers, H. Zabel, and M. Kläui, J. Phys. D: Appl. Phys. 48, 385001 (2015).
[14] S. Y. Bodnar, Y. Skourski, O. Gomonay, J. Sinova, M. Kläui, and M. Jourdan, Phys. Rev. Appl. 14, 014004 (2020).
[15] P. Wadley, B. Howells, J. Železný, C. Andrews, V. Hills, R. P. Campion, V. Novák, K. Olejník, F. Maccherozzi, S. S. Dhesi, S. Y. Martin, T. Wagner, J. Wunderlich, F. Freimuth, Y. Mokrousov, J. Kuneš, J. S. Chauhan, M. J. Grzybowski, A. W. Rushforth, K. W. Edmonds et al., Science 351, 587 (2016).
[16] S. Y. Bodnar, L. Šmejkal, I. Turek, T. Jungwirth, O. Gomonay, J. Sinova, A. A. Sapozhnik, H.-J. Elmers, M. Kläui, and M. Jourdan, Nat. Commun. 9, 348 (2018).
[17] C. Zhao, K. Kang, J. C. Neuefeind, A. Schleife, and D. P. Shoemaker, Phys. Rev. Mater. 5, 084411 (2021).
[18] S. Reimers, Y. Lytvynenko, Y. Niu, E. Golias, B. Sarpi, L. Veiga, T. Denneulin, A. Kovacs, R. E. Dunin-Borkowski, J. Bläßer et al., Nat. Commun. 14, 1861 (2023).
[19] A. A. Sapozhnik, M. Filianina, S. Y. Bodnar, A. Lamirand, M.-A. Mawass, Y. Skourski, H.-J. Elmers, H. Zabel, M. Kläui, and M. Jourdan, Phys. Rev. B 97, 134429 (2018).
[20] V. Barthem, C. Colin, H. Mayaffre, M.-H. Julien, and D. Givord, Nat. Commun. 4, 2892 (2013).
[21] A. B. Shick, S. Khmelevskyi, O. N. Mryasov, J. Wunderlich, and T. Jungwirth, Phys. Rev. B 81, 212409 (2010).
[22] H.-C. Wu, M. Abid, A. Kalitsov, P. Zarzhitsky, M. Abid, Z.-M. Liao, C. Ó. Coileán, H. Xu, J.-J. Wang, H. Liu, O. N. Mryasov, C.-R. Chang, and I. V. Shvets, Adv. Funct. Mater. 26, 5884 (2016).
[23] S. Reimers, O. Gomonay, O. J. Amin, F. Krizek, L. X. Barton, Y. Lytvynenko, S. F. Poole, V. Novák, R. P. Campion, F. Maccherozzi et al., Phys. Rev. Appl. 21, 064030 (2024).
[24] T. B. Massalski and H. Okamoto, Bull. Alloy Phase Diagrams 6, 454 (1985).
[25] J. Cui, J. P. Choi, G. Li, E. Polikarpov, J. Darsell, N. Overman, M. Olszta, D. Schreiber, M. Bowden, T. Droubay, M. J. Kramer, N. A. Zarkevich, L. L. Wang, D. D. Johnson, M. Marinescu, I. Takeuchi, Q. Z. Huang, H. Wu, H. Reeve, N. V. Vuong et al., J. Phys.: Condens. Matter 26, 064212 (2014).
[26] H. Okamoto and T. B. Massalski, Bull. Alloy Phase Diagrams 4, 401 (1983).
[27] P. C. Canfield, T. Kong, U. S. Kaluarachchi, and N. H. Jo, Philos. Mag. 96, 84 (2016).
[28] See Supplemental Material at http://link.aps.org/supplemental/10.1103/PhysRevMaterials.8.084413 for additional microscopy, magnetometry, synthesis details, and computational results.
[29] B. H. Toby and R. B. Von Dreele, J. Appl. Crystallogr. 46, 544 (2013).
[30] J. Perez-Mato, S. Gallego, E. Tasci, L. Elcoro, G. de la Flor, and M. Aroyo, Annu. Rev. Mater. Res. 45, 217 (2015).
[31] J. Rodríguez-Carvajal, Phys. B: Condens. Matter 192, 55 (1993).
[32] G. Kresse and J. Furthmüller, Phys. Rev. B 54, 11169 (1996).
[33] G. Kresse and D. Joubert, Phys. Rev. B 59, 1758 (1999).
[34] J. P. Perdew, K. Burke, and M. Ernzerhof, Phys. Rev. Lett. 77, 3865 (1996).
[35] S. L. Dudarev, G. A. Botton, S. Y. Savrasov, C. J. Humphreys, and A. P. Sutton, Phys. Rev. B 57, 1505 (1998).
[36] P. Wells and J. H. Smith, Acta Crystallogr. A 26, 379 (1970).
[37] H. J. Monkhorst and J. D. Pack, Phys. Rev. B 13, 5188 (1976).
[38] S. Steiner, S. Khmelevskyi, M. Marsmann, and G. Kresse, Phys. Rev. B 93, 224425 (2016).
[39] L. B. Freund and S. Suresh, Thin Film Materials: Stress, Defect Formation and Surface Evolution, 1st ed. (Cambridge University Press, Cambridge, 2004).
[40] T. B. Massalski and H. Okamoto, Au-Mn (Gold-Manganese), in Binary Alloy Phase Diagrams, 2nd ed., edited by T. B. Massalski (ASM International, Materials Park, Ohio, USA, 1990), Vol. 1, pp. 391–395.
[41] M. A. McGuire, H. Cao, B. C. Chakoumakos, and B. C. Sales, Phys. Rev. B 90, 174425 (2014).
[42] A. F. Andresen, W. Hälg, P. Fischer, E. Stoll, G. Eriksson, R. Blinc, S. Paušak, L. Ehrenberg, and J. Dumanović, Acta Chem. Scand. 21, 1543 (1967).
[43] V. Taufour, S. Thimmaiah, S. March, S. Saunders, K. Sun, T. N. Lamichhane, M. J. Kramer, S. L. Bud'ko, and P. C. Canfield, Phys. Rev. Appl. 4, 014021 (2015).
[44] M. N. E. Hazek and A. A. Garb, Am. J. Analyst. Chem. 7, 469 (2016).
[45] V. Lenher, J. Am. Chem. Soc. 26, 550 (1904).
[46] L. Narayani, V. Jagadeesha Angadi, A. Sukhdev, M. Challa, S. Matteppanavar, P. R. Deepthi, P. Mohan Kumar, and M. Pasha, J. Magn. Magn. Mater. 476, 268 (2019).
[47] K. Kang, K. Yang, K. Puthalath, D. G. Cahill, and A. Schleife, Phys. Rev. B 105, 184404 (2022).
[48] K. Yang, K. Kang, Z. Diao, M. H. Karigerasi, D. P. Shoemaker, A. Schleife, and D. G. Cahill, Phys. Rev. B 102, 064415 (2020).
[49] J. F. Nye, Physical Properties of Crystals: Their Representation by Tensors and Matrices, Oxford Science Publications (Clarendon Press, Oxford, 1990).
[50] R. E. Newnham, Properties of Materials: Anisotropy, Symmetry, Structure (Oxford University Press, Oxford, 2005).
[51] K. Kang, D. G. Cahill, and A. Schleife, Phys. Rev. B. 107, 064412 (2023).
[52] M. Herak, M. Miljak, G. Dhalenne, and A. Revcolevschi, J. Phys.: Condens. Matter 22, 026006 (2010).
 p2_0.jpg
 p2_1.jpg
 p3_0.jpg
 p4_0.jpg
 p4_1.jpg
 p4_2.jpg
 p4_3.jpg
 p5_0.jpg
 p5_1.jpg
 p6_0.jpg
 p7_0.jpg
 p7_1.jpg