| Transition Temperature | 12 K |
|---|---|
| Experiment Temperature | 3 K |
| Propagation Vector | k1 (0, 0, 0) |
| Parent Space Group | Cmcm (#63) |
| Magnetic Space Group | Cmc'm' (#63.463) |
| Magnetic Point Group | m'm'm (8.4.27) |
| Lattice Parameters | 4.23670 10.64720 4.00410 90.00 90.00 90.00 |
|---|---|
| DOI | 10.1088/0953-8984/26/11/116002 |
| Reference | J M Cadogan, G A Stewart, S Munoz Perez, R Cobas, B R Hansen, M Avdeev, W D Hutchison, J. Phys.: Condens. Matter (2014) 26 116002 |
| Label | Element | Mx | My | Mz | |M| |
|---|---|---|---|---|---|
| Tm1 | Tm | 5.2 | 0.0 | 0.0 | 5.20 |
Magnetic ordering in TmGa
This content has been downloaded from IOPscience. Please scroll down to see the full text.
2014 J. Phys.: Condens. Matter 26 116002
(http://iopscience.iop.org/0953-8984/26/11/116002)
View the table of contents for this issue, or go to the journal homepage for more
Download details:
IP Address: 169.230.243.252
This content was downloaded on 23/04/2015 at 08:04
Please note that terms and conditions apply.
Magnetic ordering in TmGa
J M Cadogan \( ^{1} \) , G A Stewart \( ^{1} \) , S Muñoz Pérez \( ^{1} \) , R Cobas \( ^{1} \) , B R Hansen \( ^{2} \) , M Avdeev \( ^{3} \) and W D Hutchison \( ^{1} \)
\( ^{1} \) School of Physical, Environmental and Mathematical Sciences, UNSW Canberra at the Australian Defence Force Academy, Canberra, ACT, BC 2610, Australia \( ^{2} \) Institute of Physics, Technical University of Denmark, 2800 Kongens Lyngby, Denmark \( ^{3} \) Bragg Institute, ANSTO, PMB 1, Menai, NSW 2234, Australia
E-mail: s.cadogan@adfa.edu.au
Received 14 November 2013, revised 12 January 2014 Accepted for publication 15 January 2014 Published 3 March 2014
Abstract
We have determined the magnetic structure of the intermetallic compound TmGa by high-resolution neutron powder diffraction and \( {}^{169} \) Tm Mössbauer spectroscopy. This compound crystallizes in the orthorhombic \( (Cmcm) \) CrB-type structure and its magnetic structure is characterized by magnetic order of the Tm sublattice along the a-axis. The initial magnetic ordering occurs at 15(1) K and yields an incommensurate antiferromagnetic structure described by the propagation vector \( k_{1}=[0\ 0.275(2)\ 0] \) . At 12 K the dominant ferromagnetic ordering of the Tm sublattice along the a-axis develops in what appears to be a first-order transition. At 3 K the magnetic structure of TmGa is predominantly ferromagnetic but a weakened incommensurate component remains. The ferromagnetic Tm moment reaches \( 6.7(2)\ \mu_{B} \) at 3 K and the amplitude of the remaining incommensurate component is \( 2.7(4)\ \mu_{B} \) . The \( {}^{169} \) Tm hyperfine magnetic field at 5 K is \( 631(1) \) T.
Keywords: magnetic structure, Mossbauer spectroscopy, rare-earth intermetallics
(Some figures may appear in colour only in the online journal)
1. Introduction
The orthorhombic RGa (R = rare earth) intermetallic compounds crystallize in the CrB-type \( Cmcm(\#63) \) structure with one R site and one Ga site, both 4c. The RGa compounds were first prepared in the early 1960s \( [1-4] \) and have recently attracted some interest due to their potential for use in magnetocaloric-effect-based low-temperature refrigeration applications \( [5-10] \) . In general, the RGa compounds order ferromagnetically with a Curie temperature that ranges from a high of 183 K in GdGa \( [11] \) to a low \( \sim15 \) K for TmGa \( [12, 9] \) . Neutron diffraction work on TbGa was reported in 1964 by Cable et al \( [13] \) which showed that the Tb moments order along the c-axis. In 1971, Barbara et al \( [14] \) used neutron diffraction to show that ErGa orders in a canted structure with ferromagnetism along the a-axis and antiferromagnetism along the b-axis, with a canting angle of \( 34(3)^{\circ} \) from the a-axis. In a previous paper \( [15] \) we presented a neutron diffraction study of HoGa in which we observed a spin-reorientation of the magnetic structure of the Ho sublattice. We have also recently used a combination of \( {}^{155} \) Gd Mössbauer spectroscopy and neutron powder diffraction to study the spin-reorientation in GdGa \( [16] \) in which the crystallographically equivalent Gd 4c sites split into two magnetically-inequivalent sub-sites.
The subject of this paper is TmGa which was reported to be a ferromagnet with a Curie temperature of \( 15(1) \) K by Gao et al [9]. Specific heat measurements on TmGa showed two magnetic transitions occurring at 15 and 12.5 K, the upper transition being the Curie temperature and the lower suggested to be a spin-reorientation. Single-crystal magnetization measurements on TmGa at 4.2 K by Gao et al [9] indicated that the magnetic order is along the a-axis. A substantial magnetization along the a-axis was observed and a Tm magnetic moment at 2 K of \( 6.06 \mu_{B} \) in an applied magnetic field of 7 T was reported. This is significantly smaller than the 'free-ion' value of \( 7 \mu_{B} \) . It is also clear from the curvature of the magnetization data presented by Gao et al [9] that the magnetic structure of TmGa below the 'Curie' temperature is more complex than a simple ferromagnet.
In this paper we determine the magnetic structure and the nature of the \( \sim \) 12 K 'spin-reorientation' in TmGa using high-resolution neutron powder diffraction and \( {}^{169} \) Tm Mössbauer spectroscopy. We shall show that the magnetism of TmGa is predominantly ferromagnetic but involves a coexistence of commensurate and incommensurate components, suggesting that the transition at \( \sim \) 12 K is not a 'spin-reorientation' but is likely to be a first-order transition from incommensurate antiferromagnetism to commensurate ferromagnetism.
2. Experimental methods
The TmGa sample was prepared in an argon-arc furnace. Stoichiometric amounts of the pure elements (Tm (99.9%) and Ga (99.999%)) were melted several times under pure (less than 1 ppm impurity) argon to ensure homogeneity. X-ray powder diffraction measurements were made at room temperature on a PANalytical X'Pert Pro diffractometer using Cu Kα radiation. Neutron diffraction experiments were carried out on the Echidna high-resolution powder diffractometer at the OPAL reactor in Sydney, Australia [17] using a neutron wavelength ( \( \lambda \) ) of 2.4395(5) Å. The neutron diffraction data were corrected for absorption effects and all patterns were refined using the Rietveld method and the FullProf/WinPlot programs [18, 19].
Magnetization and susceptibility measurements were made on a Quantum Design PPMS operating down to 2 K. The susceptibility measurements used an ac-field of amplitude \( 796 \, A m^{-1} \) (10 Oe) with a frequency of 137 Hz. The isothermal magnetization was measured in an applied field up to 9 T.
\( ^{169} \) Tm-Mössbauer spectra were recorded for TmGa ( \( \sim \) 10 mg cm \( ^{-2} \) ) using a 30 mCi \( {}^{169} \) Er: \( {}^{168} \) Er (10 wt%)Al source prepared by neutron-activation in the OPAL reactor in Sydney. The spectrometer was operated with the sample fixed in a helium cryostat and the source mounted on an external sinusoidal motion drive. Velocity calibration was obtained using standard samples of TmFe \( _{2} \) [20] at 5 K and TmF \( _{3} \) [21] at 80 K for the relevant operating conditions, cross-checked with a laser interferometer. At 5 K, the linewidth of the outer absorption lines of the TmFe \( _{2} \) spectrum was 16(1) mm s \( ^{-1} \) (HWHM). (The \( {}^{169} \) Tm Mössbauer M1 transition involves excited and ground state spins of \( \frac{3}{2}^{+} \) and \( \frac{1}{2}^{+} \) , as is the case with the more familiar \( {}^{57} \) Fe transition. The source half-life is 9.4 d, the \( \gamma \) -ray energy is 8.4 keV and the ‘natural’ line width is 8.1 mm s \( ^{-1} \) [22, 23].)
3. Results
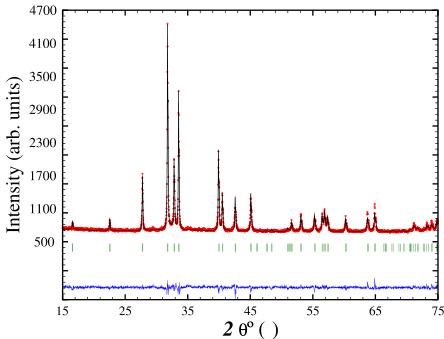
Refinement of the x-ray powder diffraction pattern obtained at 295 K and shown in figure 1 confirmed the formation of the orthorhombic CrB-type Cmcm phase. The Tm–Ga phase diagram shows five stoichiometric compounds in the range 25–65 at.% Tm and it proved impossible to prepare single-phase TmGa. Our best sample contained \( \sim \) 3 wt% of \( Tm_{3}Ga_{5} \) , as determined from the Rietveld refinements of the diffraction data. The refined lattice parameters of TmGa at 295 K are \( a = 4.2619(2) \) Å, \( b = 10.7349(2) \) Å and \( c = 4.0320(1) \) Å.

Figure 1. X-ray powder diffraction pattern of TmGa obtained at 295 K with Cu Kα radiation. The blue line shows the difference between the experimental and refined theoretical patterns.

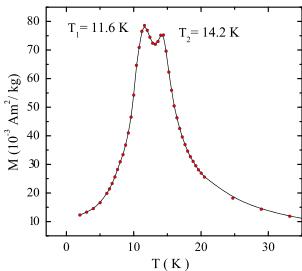
Figure 2. Temperature dependence of the ac-susceptibility of TmGa obtained in an alternating magnetic field of amplitude 796 A m \( ^{-1} \) at a frequency of 137 Hz.
3.1. Magnetometry
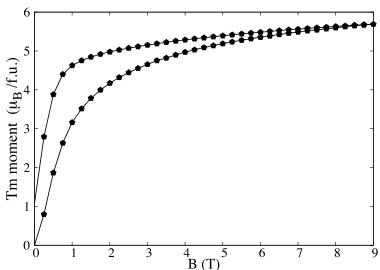
In figure 2 we show the temperature dependence of the ac-susceptibility of TmGa. Two clear magnetic transitions occur with peak temperatures of 14.2(5) and 11.6(5) K, in agreement with the results of Gao et al [9] (15 and 12.5 K). In figure 3 we show the magnetization of TmGa obtained at 2 K in an applied magnetic field up to 9 T. The field-dependent data show that TmGa is predominantly ferromagnetic at 2 K with a saturation moment of 5.7(1) \( \mu_{B} \) at 9 T, substantially smaller than the maximum value of 7 \( \mu_{B} \) expected for Tm \( ^{3+} \) . These results are in agreement with the findings of Gao et al [9]. We clearly observe hysteretic effects in the magnetization curve. If we extrapolate the magnetization to zero-field, allowing for demagnetization effects, we obtain a 'zero-field' Tm moment of 4.8(1) \( \mu_{B} \) . This 'zero-field' moment will become significant when we discuss the neutron diffraction refinements. The pronounced gradient of the magnetization curve suggests that even at 2 K the magnetic structure of TmGa is not quite a simple ferromagnet (see below).
3.2. Neutron diffraction
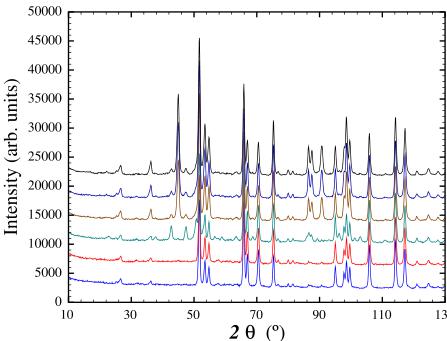
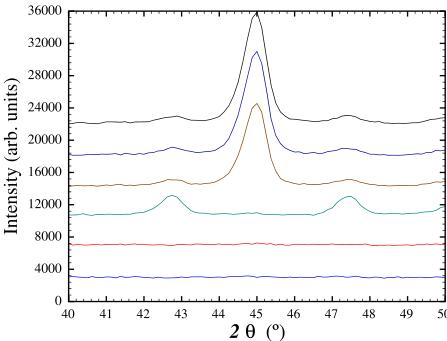
In figure 4 (upper panel) we show the set of neutron diffraction patterns obtained on TmGa over the temperature range 3–25 K.

Figure 3. Magnetization of TmGa obtained at 2 K, showing both the field-increasing and the field-decreasing curves.


Figure 4. (Top) Neutron powder diffraction patterns of TmGa obtained at (bottom to top) 25, 16, 12, 9, 6 and 3 K ( \( \lambda = 2.4395(5) \) Å). (Bottom) The same patterns as above but over the narrower angular range of \( 2\theta = 40^{\circ} - 50^{\circ} \) .
Strong magnetic contributions are seen in the patterns obtained at 12 K and below. These contributions are most pronounced in the angular range \( 40 \leq 2\theta^{\circ} \leq 50 \) and in the lower panel of figure 4 we show this angular range on an expanded scale. The strong ferromagnetic contribution to the diffraction patterns can also be seen in the three lowest-temperature patterns in the angular range around \( 2\theta \sim 90^{\circ} \) .
The pattern obtained at 12 K shows magnetic contributions which are incommensurate with the Cmcm lattice. These

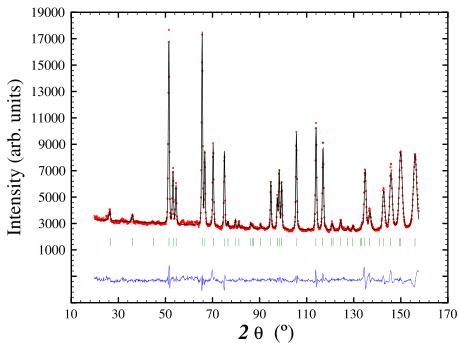
Figure 5. Refined neutron powder diffraction pattern of TmGa obtained at 25 K ( \( \lambda = 2.4395(5) \) Å).
Table 1. Crystallographic data for TmGa in the orthorhombic Cmcm cell, refined from the neutron diffraction pattern obtained at 25 K: \( a = 4.2367(5) \) Å, \( b = 10.6472(11) \) Å, \( c = 4.0041(5) \) Å.
| Atom | Site | Point symmetry | x | y | z |
| Tm | 4c | m2m | 0 | 0.3591(1) | \( \frac{1}{4} \) |
| Ga | 4c | m2m | 0 | 0.0772(2) | \( \frac{1}{4} \) |
are prominent at \( 2\theta \sim 43^{\circ} \) and \( 47.5^{\circ} \) . Upon further cooling, these incommensurate 'satellites' weaken as the strong central (021) peak appears at \( 2\theta = 45^{\circ} \) . The (021) peak is an allowed nuclear/ferromagnetic peak for the Cmcm space group \( (h + k = \text{even}) \) . However, the incommensurate satellites group \( (h + k = \text{even}) \) . However, the incommunicate satellites remain, even at 3 K, albeit with a reduced intensity. The pattern at 12 K shows no magnetic contribution to the (021) peak. Thus, we may say that the upper magnetic 'event' observed at 14–15 K by magnetometry and specific heat measurements corresponds to an initial magnetic ordering process that is incommensurate with the lattice (i.e. antiferromagnetic). The lower 'event' at 11.6–12.5 K corresponds to the development of the dominant ferromagnetic order, as seen from the (021) peak, rather than a spin-reorientation.
3.3. Nuclear diffraction pattern at 25 K
In figure 5 we show the neutron powder diffraction pattern of TmGa, obtained at 25 K. The initial magnetic ordering temperature is 14.2 K (figure 2) so the 25 K pattern comprises only the nuclear scattering from the orthorhombic Cmcm cell. In table 1 we give the atomic position parameters for TmGa deduced from our refinement of the 25 K nuclear diffraction pattern. The conventional R-factors for this refinement are \( R_{F} = 4.4 \) and \( R_{Bragg} = 4.7 \) .
3.4. Magnetic diffraction pattern at 12 K
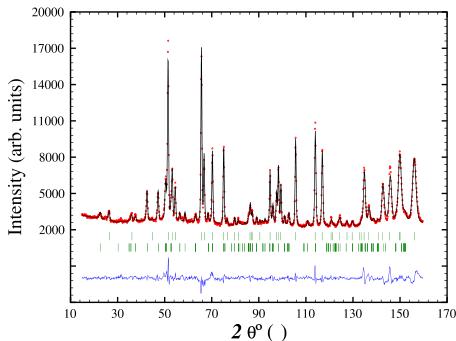
In figure 6 we show the neutron powder diffraction pattern of TmGa, obtained at 12 K. At this temperature, the initial magnetic ordering has commenced. The best refinement to this

Figure 6. Refined neutron powder diffraction pattern of TmGa obtained at 12 K ( \( \lambda = 2.4395(5) \) Å). The two rows of Bragg position markers are (top) nuclear and (bottom) incommensurate magnetic \( k_{1} \) .
Table 2. Representational analysis for the Tm(4c) site in TmGa with a propagation vector [0 0.275 0]. The 4c site splits into two ‘orbits’.
| Representation | Moment direction |
| \( \Gamma_{2} \) | Y |
| \( \Gamma_{3} \) | Z |
| \( \Gamma_{4} \) | X |
pattern involves the propagation vector \( \mathbf{k}_{1}=[0\ 0.275(2)\ 0] \) , in standard reciprocal lattice units \( (2\pi/a\ \mathrm{etc.}) \) . This incommensurate modulation of the Tm moments is either sinusoidal or square-wave; we did not observe higher harmonics of the k-vector which suggests sinusoidal modulation although the relative weakness of the magnetic scattering precludes a definitive resolution of this modulation.
In order to consider all possible magnetic structures allowed for TmGa, we carried out representational analysis for the Tm 4c site using the BASIREPS program, part of the FullProf/WinPlotr suite \( [18, 19] \) . The decomposition of the magnetic representation, for \( k_{1} = [0\ 0.275\ 0] \) , comprises three one-dimensional representations:
\[ \Gamma_{\mathrm{M a g}}^{4\mathrm{c}}=1\Gamma_{2}^{(1)}+1\Gamma_{3}^{(1)}+1\Gamma_{4}^{(1)} \quad (1) \]
and the basis vectors of these irreducible representations are given in table 2.
The best refinement was obtained with the Tm moments aligned along the a-axis, corresponding to the \( \Gamma_{4} \) representation. The refined amplitude of the Tm magnetic moment at 12 K is \( 3.1(1) \) \( \mu_{B} \) with a magnetic phase of \( 0.13^{*}2\pi \) between the two Tm ‘orbits’. The conventional R-factors for this refinement are \( R_{Bragg} = 5.3 \) , \( R_{F} = 3.2 \) and \( R_{Mag} = 9.9 \) .
3.5. Magnetic diffraction pattern at 3 K
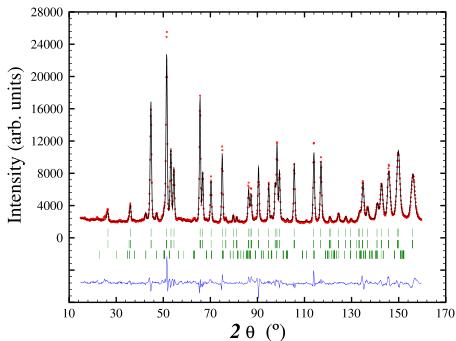
In figure 7 we show the neutron powder diffraction pattern of TmGa, obtained at 3 K. At this temperature, the magnetic ordering is well established. Our initial refinement to this

Figure 7. Refined neutron powder diffraction pattern of TmGa obtained at 3 K ( \( \lambda = 2.4395(5) \) Å). The three rows of Bragg position markers are (top) nuclear, (middle) ferromagnetic \( k_{2} \) and (bottom) incommensurate magnetic \( k_{1} \) .
Table 3. Representational analysis for the Tm(4c) site in TmGa with a propagation vector \( [0\ 0\ 0] \) . The respective atomic positions are \( (x, y, z) \) , \( (\bar{x}, \bar{y}, \bar{z}) \) , \( (\frac{1}{2} + x, \frac{1}{2} + y, z) \) , and \( (\frac{1}{2} - x, \frac{1}{2} - y, \bar{z}) \) .
| Representation | Ordering mode | Magnetic group | Moment arrangement |
| \( \Gamma_{2} \) | G \( \gamma \) | \( Cm'c'm' \) | + - + - |
| \( \Gamma_{3} \) | F \( \alpha \) | \( Cm'c'm \) | + + + + |
| \( \Gamma_{4} \) | G \( \chi \) | \( Cm \) c \( m' \) | + - + - |
| \( \Gamma_{5} \) | F \( \gamma \) | \( Cm'c \) m' | + + + + |
| \( \Gamma_{7} \) | F \( \chi \) | \( Cm \) c'm' | + + + + |
| \( \Gamma_{8} \) | G \( \alpha \) | \( Cm'c \) m | + - + - |
pattern involved two propagation vectors: a dominant ferromagnetic component \( k_{2} = [0\ 0\ 0] \) , as evidenced by the strong (021) peak between the two incommensurate 'satellites', along with the incommensurate \( k_{1} = [0\ 0.271(3)\ 0] \) , essentially the same as found at 12 K.
Representational analysis for the Tm 4c site and the propagation vector \( k_{2} = [0\ 0\ 0] \) yields the magnetic representation
\[ \Gamma_{\mathrm{M a g}}^{4\mathrm{c}}=1\Gamma_{\mathrm{2}}^{(1)}+1\Gamma_{\mathrm{3}}^{(1)}+1\Gamma_{\mathrm{4}}^{(1)}+1\Gamma_{\mathrm{5}}^{(1)}+1\Gamma_{\mathrm{6}}^{(1)}+1\Gamma_{\mathrm{7}}^{(1)}+1\Gamma_{\mathrm{8}}^{(1)} \quad (2) \]
and the basis vectors of these irreducible representations are given in table 3. In this table we have also included the magnetic space groups associated with the purely ferromagnetic \( k_{2} = [0\ 0\ 0] \) order.
The ferromagnetic component of the Tm order also has the Tm moments aligned along the a-axis, consistent with the magnetometry/susceptibility data and corresponding to the \( \Gamma_{7} \) ( \( Cmc'm' \) ) representation. The refined Tm ferromagnetic component is 5.2(1) \( \mu_{B} \) . The weakened incommensurate modulation of the Tm moments, propagating along the b-axis, has an amplitude of 2.1(2) \( \mu_{B} \) , significantly reduced from the value of 3.1 \( \mu_{B} \) observed at 12 K. The conventional R-factors for this refinement are \( R_{Bragg} = 7.3 \) , \( R_{F} = 4.2 \) and \( R_{Mag} = 16.4 \) .
At this point, there was a glaring inconsistency between the good refinement of the 3 K neutron diffraction pattern and

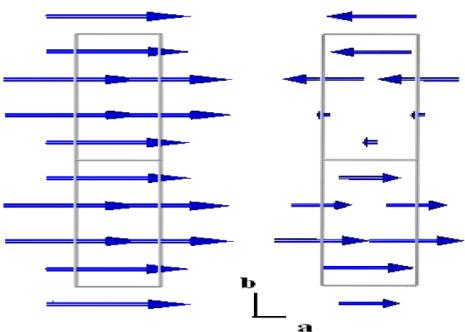
Figure 8. Ferromagnetic (left) and incommensurate (right) magnetic structures of the Tm sublattice in TmGa, shown as projections onto the ab-plane. Two cells along the b-axis (vertical direction) are shown.
the \( {}^{169} \) Tm Mössbauer results. As we will show in section 3.7, the \( {}^{169} \) Tm Mössbauer spectrum of TmGa recorded at 5 K is a reasonably sharp magnetically split sextet that corresponds to a \( Tm^{3+} \) moment of 6.67(5) \( \mu_{B} \) , much larger than the ferromagnetic Tm moment of 5.2(1) \( \mu_{B} \) deduced from the initial refinement of the 3 K neutron diffraction pattern. The Tm moment deduced by Mössbauer spectroscopy is almost saturated ( \( g_{J}J \rightarrow 7 \mu_{B} \) for \( Tm^{3+} \) ). However, as discussed earlier, our magnetization measurements, as well as those of Gao et al [9], support the lower value of the Tm moment.
The resolution of this discrepancy lies in recognizing that the two propagation vectors describing the magnetic structure of the Tm sublattice in TmGa actually describe different magnetic phases rather than a single, longitudinally-modulated ferromagnetic phase. In other words, the lower-temperature magnetic transition is most likely a first-order transition below which some of the Tm moments are ferromagnetically ordered whilst the others remain incommensurate and these two magnetic phases coexist.
A new refinement of the 3 K neutron diffraction pattern using the ferromagnetic Tm moment of \( 6.67(5)\;\mu_{\mathrm{B}} \) , found by \( {}^{169} \) Tm Mössbauer spectroscopy, yields phase fractions of 60(3)% ferromagnetic and 40(3)% incommensurate antiferromagnetic. The calculated net magnetization of TmGa at 3 K, is therefore \( 4.0(2)\;\mu_{\mathrm{B}} \) per formula unit, in reasonable agreement with the magnetometry measurements (2 K). The conventional R-factors for this new refinement are \( R_{Bragg}=6.2 \) , \( R_{F}=3.8 \) and \( R_{Mag}=14.4 \) .
In figure 8 we compare the ferromagnetic and incommensurate magnetic structures of the Tm sublattice in TmGa, drawn using the FullProf-Studio program. These structures are shown as projections onto the ab-plane with two cells-lengths along the b-axis, to illustrate the incommensurate propagation along the b-axis.
3.6. The crystal field in TmGa
Gao et al [9] measured the ac-susceptibility of a single-crystal of TmGa along the three principal crystallographic axes and one can use this information to estimate the second-order crystal field terms acting on the \( Tm^{3+} \) ion. Following the procedure outlined in the papers by Boutron [24, 25] and Bowden et al [26] and employed by Shohata et al in their study of the RGa series [27, 28], the paramagnetic Curie temperatures along the a, b and c axes of a single-crystal with orthorhombic symmetry can be written as
\[ \theta_{a}=\theta+(2J-1)(2J+3)(B_{20}+B_{22})/10 \quad (3) \]
\[ \theta_{b}=\theta-(2J-1)(2J+3)B_{20}/5 \quad (4) \]
\[ \theta_{c}=\theta+(2J-1)(2J+3)(B_{20}-B_{22})/10 \quad (5) \]
where \( \theta \) is the paramagnetic Curie temperature in the absence of crystal-field effects, J is the total angular momentum of the \( Tm^{3+} \) ion (J = 6) and the crystal-field parameters \( B_{20} \) and \( B_{22} \) are measured in units of kelvin. It is implicit in the above equation that the principal z-axis of the crystal-field is taken to be the crystallographic b-axis. The measured values of the paramagnetic Curie temperatures are \( \theta_{a} = \theta_{b} = +16 \) K and \( \theta_{c} = -21 \) K [9], yielding crystal-field parameters of \( B_{20} = -0.37 \) K and \( B_{22} = -3B_{20} = +1.11 \) K. The arbitrary choice of the b-axis as the z-axis of the electric field gradient (EFG) clearly does not correspond to the ‘principal axis’ since \( |B_{22}| > |B_{20}| \) . If we rotate the crystal-field frame so that the new z-axis is the crystallographic c-axis we obtain \( B_{20} = +0.75 \) K and \( B_{22} = 0 \) , i.e. the principal EFG frame. Furthermore, these parameters yield an EFG asymmetry parameter \( \eta \) of zero \( (= |B_{22}| / |B_{20}|) \) . We note here that the suggestion of \( \eta = 0 \) is not dictated by the orthorhombic m2m point symmetry of the Tm site. The observation of \( \eta \sim 0 \) reflects the weakness of the anisotropy between the crystal a- and b-directions (it is implicit in this simplified discussion that the higher-order crystal-field effects have been neglected. The fact that the Tm magnetic order is along the a-axis, as we shall see later, clearly illustrates the effects of terms other than the second-order crystal-field used in the above discussion). The observation that \( B_{20} \) (relative to the c-axis) is positive indicates that the easy direction of magnetic order of the Tm sublattice is perpendicular to the c-axis i.e. in the ab-plane. This is fully consistent with our neutron diffraction work and the single-crystal susceptibility results [9].
3.7. \( ^{169} \) Tm Mössbauer spectroscopy
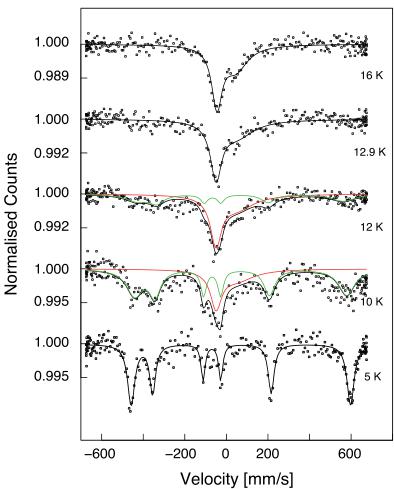
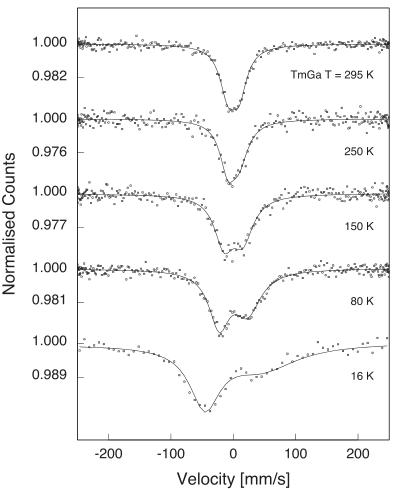
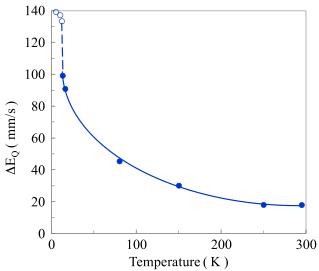
In figure 9 we show our set of \( {}^{169} \) Tm-Mössbauer spectra recorded over the temperature range 5–295 K. Above 15 K the spectra are asymmetric paramagnetic doublets whose quadrupole splitting decreases with increasing temperature as the higher levels of the \( Tm^{3+} \) crystal field split 4f shell are thermally populated. The temperature dependence of the quadrupole splitting is shown in figure 10.
Below 12 K, the spectra are dominated by a magnetically-split sextet, consistent with the ferromagnetic order determined by neutron diffraction. However, the 12.9 K spectrum is intriguing in that it has the form of a broadened paramagnetic doublet even though it is located well within the temperature range over which the incommensurate antiferromagnetic structure is observed. A key feature of all the Mössbauer spectra is the relaxation line broadening. Even at 5 K, the


Figure 9. \( {}^{169} \) Tm Mössbauer spectra of TmGa covering the temperature range 5–295 K. (Note the different velocity scales in the two plots.)

Figure 10. Temperature dependence of the quadrupole splitting, \( \Delta E_{Q} = |\frac{1}{2} e Q V_{zz} \sqrt{(1 + \frac{\eta^{2}}{3})}| \) , of the excited (I = 3/2) \( {}^{169} \) Tm nuclear level in paramagnetic TmGa (solid symbols). For comparison, the temperature dependence of the quadrupole shift term, \( 2\epsilon = \frac{1}{2} e Q V_{zz} \) , derived from the magnetic \( {}^{169} \) Tm-Mössbauer spectra, is also included (open symbols). The lines are provided as a visual guide.
fitted linewidths for the outer lines of the TmGa spectrum are larger than those obtained for the TmFe \( _{2} \) calibration spectrum (HWHM of 21 mm s \( ^{-1} \) compared with 16 mm s \( ^{-1} \) ). An explanation for the apparent contradiction may lie in temporal fluctuations of the incommensurate phase’s local Tm moments at a rate that is slow in terms of the neutron scattering time but comparable to the \( {}^{169} \) Tm nuclear Larmor precession. For the neutron wavelength of 2.4395 Å employed here, a single neutron scattering event (e.g. traversing a distance of 20 unit cells) represents a measurement time of \( \tau \sim 0.01 \) ns. At 5 K, the magnetic hyperfine field measured at the \( {}^{169} \) Tm nucleus (see below) corresponds to a Larmor precession time of \( \tau \sim 0.5 \) ns which is 50 times larger. This value will increase further as the temperature increases and the hyperfine field is reduced. If we accept that relaxation broadening is a signature of the incommensurate phase, then the presence of an additional broadened doublet (green lines) in the 10 K spectrum offers support for the neutron diffraction results where the incommensurate mode was observed to persist to temperatures well below the first-order transition temperature.
Because of the large magnetic splitting involved, the 5 K \( {}^{169} \) Tm spectrum can be interpreted in terms of a simple (first-order perturbation) nuclear Hamiltonian, using conventional notation:
\[ \mathcal{H}_{\mathrm{N}}=g_{\mathrm{n}}\mu_{\mathrm{N}}B_{\mathrm{hf}}\hat{I}_{z}+\frac{1}{12}(e Q V_{z z})[3\hat{I}_{z}^{2}-I(I+1)] \quad (6) \]
with a fitted hyperfine field of \( B_{\mathrm{hf}} = 631(5) \) T and an electric field gradient of \( V_{zz} = -54.7(9) \times 10^{21} \) V m \( ^{-2} \) . It is reasonable to assume that any transferred magnetic hyperfine field at the \( {}^{169} \) Tm nuclei from the neighboring ferromagnetically ordered Tm moments is negligible and this is undoubtedly the case relative to the overwhelming 4f contribution. Therefore we can assume that the measured \( B_{hf} \) is fully 4f in origin. In any event, the contributions to the \( {}^{169} \) Tm hyperfine field in TmGa will be proportional to \( \langle J_{z} \rangle \) . Comparison of the experimental hyperfine field value with the ‘free ion’ value of 662.5 T [29] then yields a CF-quenched expectation value of \( \langle J_{z} \rangle = 5.71(5) \) and hence a local Tm \( ^{3+} \) moment of 6.67(5) \( \mu_{B} \) , just 5% less than the maximum allowed value of 7 \( \mu_{B} \) .
4. Conclusions
We have used neutron powder diffraction to show that the initial magnetic ordering at 14.2 K of the Tm sublattice in TmGa is incommensurate antiferromagnetic along the orthorhombic a-axis. A second magnetic transition at 11.6 K is suggested to
be first-order in which the majority of the Tm moments effectively 'lock-in' to a dominant ferromagnetism along the a-axis with the minority remaining in the incommensurate state. At 3 K the Tm ferromagnetic moment is \( 6.7(1)\ \mu_{\mathrm{B}} \) and \( 60(3)\% \) of the Tm moments are involved in the ferromagnetic order. The \( {}^{169} \) Tm hyperfine magnetic field measured by Mössbauer spectroscopy at 5 K is \( 631(5) \) T.
Acknowledgments
This project received financial support from the University of New South Wales (JMC), the Australian Institute of Nuclear Science and Engineering through their grant ALNGRA12053 (GAS and JMC) and the Danish Research Council for Nature and Universe (Danscat) (BRH). JMC and GAS are grateful to staff at the OPAL reactor in Sydney where the activation of the \( {}^{169} \) Tm Mössbauer source used in this study was carried out. We also acknowledge the assistance of H.L. Phelps during some of the measurements.
References
[1] Iandelli A 1960 The Physical Chemistry of Metallic Solutions and Intermetallic Compounds vol 1 (New York: Chemical Publishing Co., Inc.) p 376
[2] Baenziger N C and Moriarty J L Jr 1961 Acta Crystallogr. 14 946
[3] Schob O and Parthé E 1965 Acta Crystallogr. 19 214
[4] Dwight A E, Downey J W and Conner R A Jr 1967 Acta Crystallogr. 23 860
[5] Zhang J Y, Luo J, Li J B, Liang J K, Wang Y C, Ji L N, Liu Y H and Rao G H 2009 J. Alloys Compounds 469 15
[6] Chen J, Shen B G, Dong Q Y, Hu F X and Sun J R 2009 Appl. Phys. Lett. 95 132504
[7] Chen J, Shen B G, Dong Q Y and Sun J R 2010 Solid State Commun. 150 157
[8] Zheng X Q, Chen J, Shen J, Zhang H, Xu Z Y, Gao W W, Wu J F, Hu F X, Sun J R and Shen B G 2012 J. Appl. Phys. 111 07A917
[9] Gao T, Nishimura K, Matsumoto T, Namiki T and Isikawa Y 2013 Solid State Commun. 158 1
[10] Mo Z J, Shen J, Yan L Q, Tang C C, Lin J, Wu J F, Sun J R, Wang L C, Zheng X Q and Shen B G 2013 Appl. Phys. Lett. 103 052409
[11] Fujii H, Shohata N, Okamoto T and Tatsumoto E 1971 J. Phys. Soc. Japan 31 1592
[12] Barbara B, Nguyen V N and Siaud E 1972 C. R. Acad. Sci. B274 1053
[13] Cable J W, Koehler W C and Wollan E O 1964 Phys. Rev. 136 A240
[14] Barbara B, Bècle C, Nguyen N N and Siaud E 1971 Conf. Digest No. 3: Rare-Earths and Actinides (Durham: Institute of Physics) p 219
[15] Susilo R A, Muñoz-Pérez S, Cobas R, Cadogan J M and Avdeev M 2012 J. Phys.: Conf. Ser. 340 012071
[16] Susilo R A, Cadogan J M, Ryan D H, Lee-Hone N R, Cobas R and Muñoz-Pérez S 2013 Hyperfine Interact. doi: 10.1007/s10751-013-0924-4
[17] Liss K-D, Hunter B A, Hagen M E, Noakes T J and Kennedy S J 2006 Physica B 385–386 1010
[18] Rodríguez-Carvajal J 1993 Physica B 192 55
[19] Roisnel T and Rodríguez-Carvajal J 2001 Mater. Sci. Forum 378–381 118
[20] Bleaney B, Bowden G J, Cadogan J M, Day R K and Dunlop J B 1982 J. Phys. F: Met. Phys. 12 795
[21] Wortmann G 1968 Measurements of second order magnetic hyperfine interactions in thulium compounds Diploma Thesis TU München, Germany
[22] Cadogan J M and Ryan D H 2004 Hyperfine Interact. 153 25
[23] Stewart G A 1985 Hyperfine Interact. 23 1 Stewart G A 1994 Mater. Forum 18 177
[24] Boutron P 1969 J. Physique 30 413
[25] Boutron P 1973 Phys. Rev. B 7 3226
[26] Bowden G J, Bunbury D St P and McCausland M A H 1971 J. Phys. C: Solid State Phys. 4 1840
[27] Shohata N, Fujii H and Okamoto T 1974 J. Phys. Soc. Japan 37 567
[28] Shohata N 1977 J. Phys. Soc. Japan 42 1873
[29] Bleaney B 1979 Magnetic Properties of Rare Earth Metals ed R J Elliott (London: Plenum) chapter 8
 p3_0.jpg
 p3_1.jpg
 p4_0.jpg
 p4_1.jpg
 p4_2.jpg
 p4_3.jpg
 p5_0.jpg
 p5_1.jpg
 p6_0.jpg
 p7_0.jpg
 p7_1.jpg
 p7_2.jpg