| Transition Temperature | 32 K |
|---|---|
| Experiment Temperature | 4.2 K |
| Propagation Vector | k1 (0, 0, 0) |
| Parent Space Group | R-3c (#167) |
| Magnetic Space Group | C2/c (#15.85) |
| Magnetic Point Group | 2/m (5.1.12) |
| Lattice Parameters | 4.77200 4.77200 15.63700 90.00 90.00 120.00 |
|---|---|
| DOI | 10.1088/0370-1328/92/1/319 |
| Reference | P.J. Brown and J.B. Forsyth, Proceedings of the Physical Society (1967) 92 125-135. |
| Label | Element | Mx | My | Mz | |M| |
|---|---|---|---|---|---|
| Mn1 | Mn | 1. | 2. | 0.0 | 1.73 |
The spatial distribution of ferromagnetic moment in \( MnCO_{3} \)
This content has been downloaded from IOPscience. Please scroll down to see the full text.
1967 Proc. Phys. Soc. 92 125
(http://iopscience.iop.org/0370-1328/92/1/319)
View the table of contents for this issue, or go to the journal homepage for more
Download details:
IP Address: 130.217.227.3
This content was downloaded on 09/07/2014 at 17:42
Please note that terms and conditions apply.
The spatial distribution of ferromagnetic moment in \( MnCO_{3} \)
P. J. BROWN† and J. B. FORSYTH‡
† Cavendish Laboratory, Cambridge
Solid State Physics Division, Atomic Energy Research Establishment, Harwell, Didcot, Berks.
MS. received 4th May 1967
Abstract. Measurements of the scattering from the ferromagnetic component of magnetic moment in \( MnCO_{3} \) at \( 4\cdot2^{\circ}K \) in applied fields of \( 1\cdot57 \) and \( 7\cdot0 \) kOe have been made using the polarized neutron method. An x-ray refinement of the structure was carried out to obtain accurate values for the positional parameter of the oxygen atom. From the results the distributions of the aligned spin density in the \( [1\overline{1}0] \) projection have been calculated and these indicate that a significant proportion of the ferromagnetically aligned moment is not located within \( 1\cdot2\AA \) of the manganese nucleus. The observed distributions have been separated into field-dependent and spontaneous parts, and the contribution of spin-orbit coupling to the spontaneous part has been estimated. Both moment distributions show considerable departures from spherical symmetry around the manganese atoms; the degree to which these can be explained by a simple theory of covalency is discussed.
1. Introduction
The phenomenon of weak ferromagnetism has been observed in a number of simple antiferromagnetic substances and has been the object of considerable experimental and theoretical interest. A small spontaneous magnetization of this kind was first observed in \( \alpha \) -Fe \( _{2} \) O \( _{3} \) by Néel and Pauthenet (1952), and in MnCO \( _{3} \) and CoCO \( _{3} \) by Borovik-Romanov and Orlova (1956). A thermodynamic theory for the occurrence of weak ferromagnetism has been given by Dzialoshinskii (1957); according to his theory the spins in weakly ferromagnetic materials, which in the 'ideal' antiferromagnetic structure would be antiparallel, are slightly canted towards one another giving rise to a small residual moment. This can arise when the magnetic symmetry allows a term in the free energy of the form D. \( (S_{x}\times S_{y}) \) where \( S_{x} \) , S, are the spin vectors on pairs of atoms which are nearly antiparallel. The origin of this term has been attributed by Moriya (1960) to the anisotropic superexchange interaction including spin-orbit coupling.
Nathans et al. (1964) have made a polarized neutron study of the spontaneous moment in \( \alpha \) -Fe \( _{2} \) O \( _{3} \) ; however, because of the very small size of the ferromagnetic component and the restrictions imposed by the details of the experiment, they were only able to observe a significant ferromagnetic scattering in four reflections. These were sufficient to show that the ferromagnetic spin density could not be symmetrically located on the iron atom positions, and strongly suggest that the distribution of the ferromagnetic moment differs from that of the antiferromagnetic moment. Such a situation cannot arise from a simple canting of moments. Kaplan (1964) has shown that an additional contribution to the magnetic scattering in the ferromagnetic reflections may arise from the effects of spin-orbit coupling, and he has estimated its magnitude for S-state ions. He found that the magnitude of the spin-orbit term in \( \alpha \) -Fe \( _{2} \) O \( _{3} \) , is of the same order as the spontaneous moment, and the results of his first-order calculation agreed quite well with the observations for three of the four reflections measured.
A further example of an S-state ion exhibiting weak ferromagnetism is provided by \( Mn^{2+} \) in \( MnCO_{3} \) . Single-crystal measurements of the bulk magnetization by Borovik-Romanov (1959) show that the spontaneous moment extrapolated to \( 0^{\circ}K \) is 188 e.m.u /mole compared with 57.5 e.m.u./mole for \( \alpha \) -Fe \( _{2} \) O \( _{3} \) above \( 260^{\circ}K \) . Since the size of the moment on the cation in \( MnCO_{3} \) is thus some seven times larger than that in haematite, a very much more detailed investigation of the spatial distribution of the moment is possible.
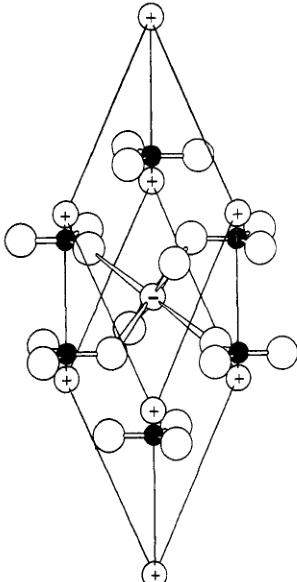
\( MnCO_{3} \) has the \( NaNO_{3} \) type structure illustrated in figure 1. The magnetic structure has been determined by Alikhanov (1959) using the neutron powder method; the magnetic
and chemical cells are of the same size and the spins lie in the basal plane. The manganese ions are at 000 and \( \frac{1}{1}\frac{1}{1} \) in the rhombohedral cell \( ^{\dagger} \) and the moments on them are nearly antiparallel. The magnetic measurements made by Borovik-Romanov show that the weak ferromagnetism also lies in the basal plane in agreement with Dzialoshinskii's theory.

Figure 1. The structure of \( MnCO_{3} \) . The closed circles represent carbon atoms and the large open circles oxygen. The manganese atoms are shown as small open circles and the spins on the atoms at the corners of the unit cell are approximately antiparallel to the spin on the atom at \( \frac{1}{2}\frac{1}{2} \) .
2. Experimental method
The magnetic scattering from the spontaneous moment in weak ferromagnets is too small to be measured except by using the polarized neutron method. To obtain the maximum sensitivity with this technique the moment must be aligned parallel to the neutron polarization direction and this is perpendicular to the incident and diffracted beams in the usual experimental arrangement. It is therefore desirable to mount the crystal so that the weak ferromagnetic moment can be aligned in this direction by an external field. Since the anisotropy in the basal plane is small, either of the principal directions \( [1\overline{1}0] \) , \( [2, \overline{1}, \overline{1}] \) is suitable, enabling reflections of the forms \( (hhl) \) and \( (h, 2h-l, l) \) , respectively, to be measured.
In the structure described above the antiferromagnetic component of spin density is reversed by the operation of the c glide plane of space group R3c; the Mn ions at 000, \( \frac{1}{2}\frac{1}{2} \) are also related by this element rather than by a simple translation.
The ferromagnetic component, on the other hand, cannot be reversed by the glide plane. Under these conditions the major part of the antiferromagnetic component contributes to reflections with \( h+k+l \) odd. Any aspherical part of the antiferromagnetic
† The rhombohedral cell will be used to describe directions and face indices throughout this paper.
component may contribute to reflections with \( h+k+l \) even except those of the form hhl with l even, to which the antiferromagnetic component cannot contribute because of the presence of the c glide plane. The small ferromagnetic component only contributes significantly to reflections with \( h+k+l \) even. To measure the ferromagnetic distribution alone it is therefore necessary to confine the measurements to (hhl) reflections with l even, and the crystal was therefore mounted with the \( [1\overline{1}0] \) direction vertical.

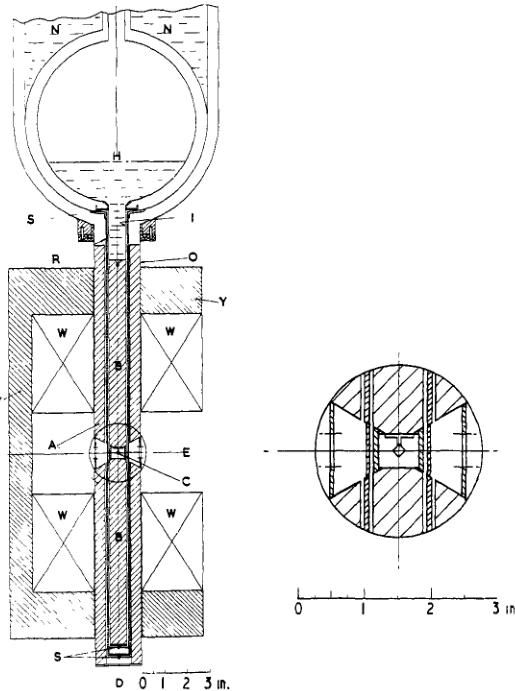
Figure 2. Schematic arrangement of the cryostat and magnet assembly. The inset shows an enlarged view of the tail section around the specimen position.
The experimental arrangement is illustrated in figure 2: it allows the specimen C to be maintained at \( 4.2^{\circ} \) K in a magnetic field directed along the diffractometer axis D. The magnet windings W and the iron yoke Y are fixed to the centre table of the diffractometer. The cryostat has a long tail section enclosed in a stainless-steel outer tube O with a wall thickness of 0.015 in. Each magnet pole is divided into an outer annulus A and an inner cylinder B, the latter fitting easily into the thin-walled stainless-steel tail of the helium reservoir H. An aluminium radiation shield R is attached to the nitrogen vessel N: the whole tail assembly is held concentric by Tufnol spacers S. The manganese carbonate crystal C is glued to its aluminium mount which is in turn glued to the upper pole B. The neutron beam at the height E passes through the radiation shield and the two stainless-steel tubes: for most positions of the cryostat the beam passes through slots cut in the
0·040 in. thick aluminium spacers which keep the outer and inner pole sections AA, BB apart. As the cryostat is free to rotate relative to the rest of the magnet a whole zone of reflections is accessible for measurement.
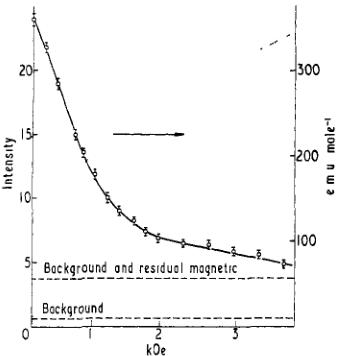
In order to find the field necessary to overcome any anisotropy and to orient the trigonal domains, the intensity of the antiferromagnetic (001) reflection was measured as a function of field. For this reflection the domain with antiferromagnetic spin direction in the scattering plane has \( \sin^{2}\alpha=0\cdot0653 \) , where \( \alpha \) is the angle between the spin direction and the scattering vector; for the other two domains \( \sin^{2}\alpha=0\cdot7666 \) . The intensity should therefore decrease to 12% of its zero-field value at complete saturation. Figure 3 shows

Figure 3. The field dependence of the magnetic scattering intensity from the (001) reflection of \( MnCO_{3} \) : the intensities are on the arbitrary scale. The broken curve shows the field dependence of the magnetization which may be derived from the scattered intensity.

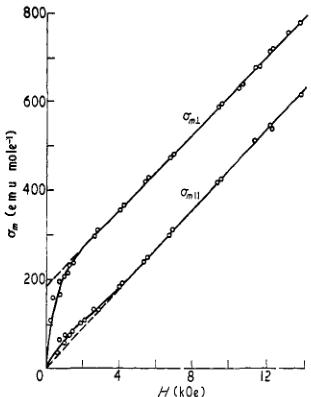
Figure 4. Magnetization curves for \( MnCO_{3} \) . (After Borovik-Romanov 1959.)
the observed field dependence of the (001) reflection intensity and the shape of the magnetization curve which this implies. The measurements made by Borovik-Romanov (1959) are reproduced in figure 4: a fairly close correspondence is apparent.
An attempt to distinguish between the effects of the spontaneous magnetization and those of the field-induced magnetization was made by carrying out the experiment at two values of the applied field. The lower field was chosen to be about \( 1.6 \, kOe \) where a recognizable knee occurs in both magnetization curves and over \( 96\% \) of the spontaneous magnetization has been aligned. The higher field was limited to \( 7 \, kOe \) by the magnet available for the experiment.
3. X-ray structure refinement
No reinvestigation of the structure of \( MnCO_{3} \) had been undertaken since the early work of Bragg (1914) and Wykoff (1920). Since the calculation of the absolute magnetic scattering amplitudes from the polarized neutron measurements depends on an accurate knowledge of the nuclear structure factors it was considered necessary to undertake a single-crystal X-ray refinement to obtain the oxygen positional parameter to greater accuracy.
Measurements of the integrated intensities of \( (hk0) \) reflections were made using the automatic diffractometer MAXIM with crystal monochromatized \( AgK_{\alpha} \) radiation. The mean structure amplitudes for the 110 independent reflections measured were calculated and a structure refinement carried out using the difference Fourier method. A single scaling factor, three independent isotropic temperature factors and the single positional parameter were optimized. The final R factor \( \Sigma|F_{0}-F_{c}|/\Sigma|F_{c}| \) was 0.038. The oxygen positional parameter was found to be \( 0.2698\pm0.0005 \) in excellent agreement with the early work (0.27).
4. Neutron results
The flipping ratios for 14 low-angle hhl reflections with l even were measured at fields of \( 1.57 \, kOe \) and \( 7.0 \, kOe \) at \( 4.2 \, ^{\circ}K \) , \( 0.93 \, \AA \) . The results are given in table 1 and are the means of values measured for hhl and \( \overline{hh}l \) . They have been corrected for incomplete
Table 1. Observed values of \( \gamma \) , the ratio of magnetic to nuclear structure factors, corresponding to 1·57 and 7·0 kOe applied field
| hhl | sin θ/λ | Applied field 7·0 kOe | Applied field 1·57 kOe | ||
| γ = p/b | P(μ3) | γ = p/b | P(μB) | ||
| 222 | 0 194 | -0·00447 ± 6 | 0 0906 ± 13 | -0·00211 ± 10 | 0·0432 ± 20 |
| 444 | 0 388 | 0 00249 ± 14 | 0·0373 ± 21 | 0 00138 ± 23 | 0·0207 ± 23 |
| 554 | 0 46 | -0 00164 ± 21 | 0·0175 ± 22 | -0 00069 ± 28 | 0·0074 ± 30 |
| 332 | 0·285 | 0 01232 ± 37 | 0 0665 ± 17 | 0·00574 ± 42 | 0·0310 ± 23 |
| 110 | 0 140 | -0·01144 ± 12 | 0·1224 ± 13 | -0·00564 ± 28 | 0 0603 ± 30 |
| 112 | 0 177 | 0 01961 ± 26 | 0 1059 ± 14 | 0 00900 ± 30 | 0·0486 ± 15 |
| 334 | 0 344 | -0 00485 ± 16 | 0 0519 ± 17 | -0 00223 ± 23 | 0·0239 ± 25 |
| 442 | 0 413 | -0 01148 ± 73 | 0 0405 ± 26 | -0 0067 ± 9 | 0·0235 ± 32 |
| 220 | 0·280 | -0 0202 ± 12 | 0 0357 ± 22 | -0 0134 ± 17 | 0 0238 ± 30 |
| 002 | 0·250 | -0 0246 ± 5 | 0 0868 ± 19 | -0·00985 ± 63 | 0·0348 ± 22 |
| 224 | 0·355 | -0 0255 ± 18 | 0·0451 ± 31 | -0 0112 ± 13 | 0·0199 ± 21 |
| 330 | 0·42 | -0 00287 ± 18 | 0·0488 ± 26 | -0·00108 ± 23 | 0·0161 ± 34 |
| 112 | 0 37 | 0·00463 ± 19 | 0·0444 ± 18 | 0·00280 ± 28 | 0 0269 ± 27 |
| 114 | 0 42 | -0·00198 ± 15 | 0·0295 ± 22 | -0 00133 ± 28 | 0·0198 ± 42 |
The values of P, the magnetic scattering in Bohr magnetons, are also given.
neutron polarization and spin reversal. A subsidiary experiment using the same crystal was made at room temperature with unpolarized neutrons and no field to check for the presence of extinction. The integrated intensities of 340 (46 independent) general low-angle reflections were measured at a wavelength of \( 1 \cdot 0.4 \AA \) with a Ferranti–Hilger automatic diffractometer. Using the structure derived from the X-ray refinement an R factor of 0·05 was obtained and no evidence for extinction in the strong reflections was found. It is therefore permissible to derive the magnetic scattering amplitudes from the calculated \( \gamma \) values, and these are also given in table 1.
5. The spatial distribution of the moment
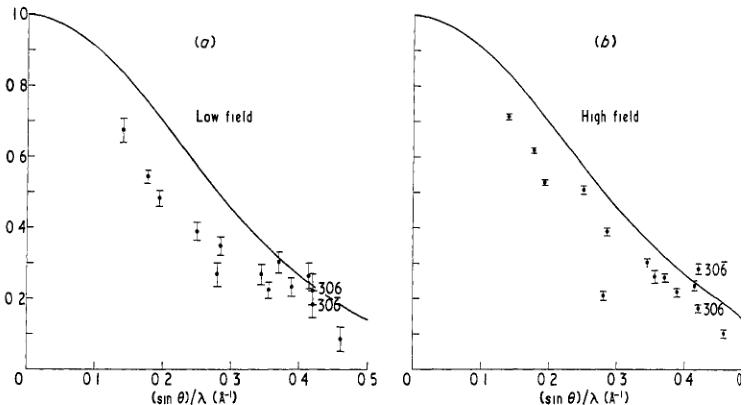
The values of magnetization observed by Borovik-Romanov (1959) at \( 4 \cdot 2^{\circ} \) K for fields of \( 1 \cdot 57 \) and \( 7 \cdot 0 \) kOe are 250 e.m.u./mole and 487 e.m.u./mole respectively corresponding to \( 0 \cdot 0447 \) and \( 0 \cdot 0871 \mu_{B} \) per Mn atom. These values can be used to convert the measured magnetic scattering factors to an experimental form factor, assuming the whole moment to be associated with the manganese atoms. They are shown in figure 5 and compared

Figure 5. Magnetic form factors derived from the measurements of (a) 1·57 kOe and (b) 7·0 kOe. The observations are normalized from the experimentally observed magnetization and the full curves correspond to the theoretical calculation for \( Mn^{2+} \) 3d \( ^{5} \) (Watson and Freeman 1961).
with the \( Mn^{2+} \) 3d \( ^{5} \) form factor calculated by Watson and Freeman (1961). It will be seen that the low-angle observations all fall below the theoretical curve which suggests that not all the moment is located near to the manganese atom. In addition, the majority of the observations cannot be said to lie on a single smooth curve; it therefore appears unprofitable to use this approximation for further analysis.
An alternative approach is to use the observed structure factors to calculate, by Fourier inversion, a projection of the ferromagnetic spin density down the \( [1\overline{1}0] \) direction. From this, using a development of the technique (Brown and Wilkinson 1965), a direct calculation of the moment located within a specified radius of the manganese atom centre may be made and the form factor corresponding to the average radial distribution of this moment obtained. The results of this calculation of the spherically averaged form factors are shown in table 2. The validity of these results may be questioned since the measurements extend only to \( (\sin\theta)/\lambda=0\cdot5\mathring{\mathrm{A}}^{-1} \) , so that series termination effects may be important. To distinguish the effects of series termination, magnetic structure factors for those reflections measured in the experiment were calculated using the \( Mn^{2+} \) 3d form factor of Watson and Freeman (1961). A further calculation of circularly symmetric form factors was then carried out using these structure factors as input data. The results of this calculation are tabulated in the second column of table 2 for comparison. The numbers at the bottom of the table give the percentage of the total moment included within a circle of radius \( 1\cdot0\mathring{A} \) in each case. Radii greater than \( 1\mathring{A} \) resulted in a lowering of the included moment in the model calculation owing to the inclusion of negative areas introduced by series termination. The percentage of total moment included for both high- and low-field measurements is significantly less than that for the theoretical \( Mn^{2+} \) distribution. This suggests that about 10% of the moment in the high field and 20% in the low field is transferred from the manganese ion to the regions of the ligand ions.
Table 2. Circularly symmetric form factors calculated for a manganese radius of 1 Å
| sin θ | Circularly symmetric form factors calculated for RMn = 1·0 Å | ||||
| Theoretical Mn²• | H = 7·0 kOe | H = 1·57 kOe | Field-induced | Spontaneous | |
| 0·00 | 1·000 | 1·000 | 1·000 | 1·000 | 1·00 |
| 0·05 | 0·979 | 0·978 | 0·981 | 0·978 | 0·977 |
| 0·10 | 0·918 | 0·914 | 0·925 | 0·916 | 0·911 |
| 0·15 | 0·823 | 0·816 | 0·838 | 0·819 | 0·810 |
| 0·20 | 0·704 | 0·693 | 0·729 | 0·697 | 0·684 |
| 0·25 | 0·572 | 0·558 | 0·608 | 0·564 | 0·548 |
| 0·30 | 0·438 | 0·425 | 0·486 | 0·430 | 0·414 |
| 0·35 | 0·313 | 0·302 | 0·371 | 0·307 | 0·292 |
| 0·40 | 0·205 | 0·198 | 0·269 | 0·202 | 0·191 |
| 0·45 | 0·118 | 0·116 | 0·184 | 0·119 | 0·113 |
| 0·50 | 0·056 | 0·058 | 0·118 | 0·059 | 0·059 |
| % total moment | |||||
| inside | 95·5 | 83·6 | 74·6 | 86·5 | 75·5 |
| 1·0 Å | |||||
| radius | |||||
The second column contains the results of applying the calculation to a set of structure factors corresponding to Watson and Freeman's theoretical form factor for \( Mn^{2+} \) 3d \( ^{5} \) .
If we assume that the spin density at any point is the sum of two parts, one due to the spontaneous magnetization and the other to the field-induced magnetization, values obtained from the magnetization curves in figure 4 allow us to combine the measurements at the two fields to deduce the magnetic structure factors for these two components separately. The resulting values are listed in table 3, and the form factors calculated as above in the
Table 3. Structure factors corresponding to the spontaneous and field-induced moments
| hhl | Field-induced magnetic structure factors ( \( \mu_{B} \) ) | Spontaneous aligned magnetic structure factors ( \( \mu_{B} \) ) |
| 222 | 0.487 ± 29 | 0.454 ± 40 |
| 444 | 0.195 ± 37 | 0.245 ± 47 |
| 554 | 0.119 ± 44 | 0.068 ± 61 |
| 332 | 0.421 ± 34 | 0.319 ± 47 |
| 110 | 0.733 ± 39 | 0.652 ± 60 |
| 112 | 0.679 ± 25 | 0.439 ± 31 |
| 334 | 0.380 ± 36 | 0.161 ± 51 |
| 442 | 0.198 ± 49 | 0.287 ± 65 |
| 220 | 0.137 ± 44 | 0.293 ± 61 |
| 002 | 0.615 ± 35 | 0.303 ± 45 |
| 224 | 0.297 ± 45 | 0.193 ± 44 |
| 330 | 0.388 ± 51 | 0.101 ± 69 |
| 112 | 0.204 ± 39 | 0.337 ± 55 |
| 114 | 0.112 ± 57 | 0.263 ± 84 |
Both sets of structure factors have been normalized to one Bohr magneton per manganese ion.
last two columns of table 2. The values of table 3 can be used to calculate Fourier projections corresponding to the distribution of field-induced and spontaneous magnetizations, but these will also contain features caused by series termination. Shull and Mook (1966) have shown how to distinguish series termination effects from real features of such distributions by using a resolution function which averages the observed distribution over a unit


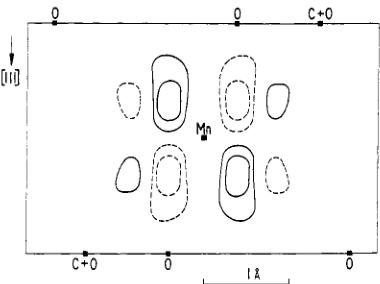
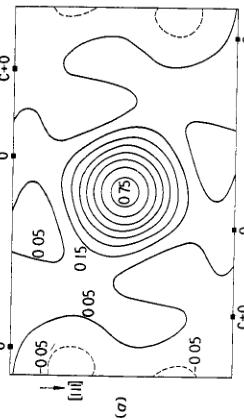
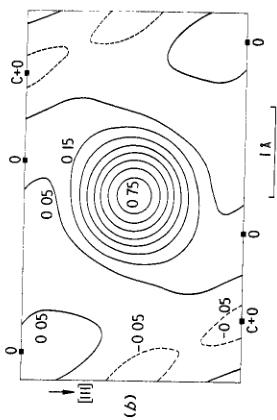
Figure 6. [110] projections of the ferromagnetic spin density corresponding to the spontaneous moment in MnCo \( ^{0.3} \) . Averaging lengths of 0.20 and 0.32 Å have been used for figures (b)(a) and (b)(c) respectively. The contour intervals are 0.1 Å and the maps are normalized to 1 Å per Mn atom. Significance levels are between 0.02 and 0.05 Å \( ^{2} \) . The magnanese atom is at the centre of each figure and the positions of carbon and oxygen atoms are indicated by the closed squares.


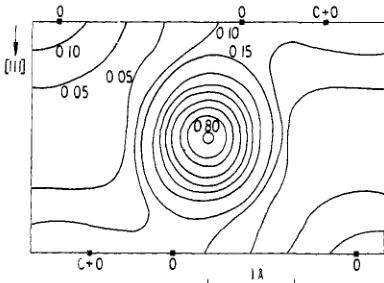
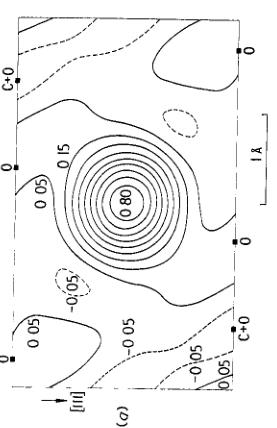
Figure 7. [110] projections of the ferromagnetic spin density corresponding to the field-induced moment in MnCo \( ^{0.3} \) . Averaging lengths of 0.29 and 0.32 Å have been used for figures (b)(a) and (b) respectively. The contour intervals are 0.1 Å and the maps are normalized to 0.1 Å per Mn atom. Significance levels are between 0.02 and 0.05 A \( ^{2} \) . The magnanese atom is at the centre of each figure and the position of the carbon and oxygen atoms are indicated by the closed squares.
cube, the size of which is varied; features in the distributions which do not change as the size is varied were shown not to be caused by series termination. The corresponding Fourier projections for two values of the resolution length are reproduced in figures 6 and 7.
6. Discussion
Comparison of the density distributions of the spontaneous moment computed for five values of the resolution length \( \delta \) between 0 and 0.5 Å, only two of which are shown in figure 6, suggest that the real features of the distribution are the small extensions of the density around the manganese atom in the directions of its oxygen neighbours which are not overlapped by carbon in this projection. Similarly the real features of the field-induced distribution (figure 7) are the elongation of the manganese density and the existence of small but significant positive areas on the non-overlapped oxygen atoms. In particular, it can be seen clearly from these figures that the spatial distributions of the two contributions are different from one another.
A simple model for the origin of the ferromagnetic moments in 'weak ferromagnets' suggests that the spatial distribution of the spontaneous and field-induced moments should be identical, since they are both presumed to arise from canting of the localized ionic moments of the antiferromagnetic structure. However, Kaplan's simple extension of the theory suggests that a further contribution to the spontaneous spin density distribution will arise from the effects of spin-orbit coupling; this particular contribution is field independent and therefore will not appear in the field-induced distribution; it may therefore be responsible for some or all of the difference. Applying Kaplan's first-order theory to the structure of \( MnCO_{3} \) and estimating the values \( \Delta/J \simeq 0.29 \) and \( \lambda/J \simeq 0.009 \) we have calculated the projected density distribution of the term \( \sigma_{1} \) in his paper. \( \Delta \) is the crystal-field splitting, J the intra-atomic exchange energy and \( \lambda \) the spin-orbit coupling parameter. The calculated distribution which is shown in figure 8 has been averaged

Figure 8. [1I0] projection of the contribution to the spin density in \( MnCO_{3} \) arising from spin-orbit coupling. The averaging length is 0.32 Å and the contour intervals are \( 0.02 \mu_{B} \) , i.e. one-fifth of those in figures 7 and 8.
over a resolution length of \( 0.32 \AA \) so that it is directly comparable with the observed distributions of figures 6 and 7. Detailed comparison of the observed and calculated distributions shows that the difference between the spontaneous and field-induced distributions cannot be attributed wholly to this term although it may account for some rather small part of the difference. It seems therefore that some further theoretical investigation of the origin of the spontaneous moment is necessary to explain these differences.
It seems reasonable to suppose that the distribution of the field-induced moment reflects that of the antiferromagnetically aligned moment and therefore to seek to explain the deviations from circular symmetry by the presence of covalency. We have used the
approach suggested by Hubbard and Marshall (1965) to calculate the spin distribution associated with \( \sigma \) or \( \pi \) antibonding orbitals between manganese and its six oxygen neighbours. The calculation has been made for an isolated octahedral complex and the spin density evaluated as the sum of the spin densities of separate complexes centred on each of the manganese atoms in the structure: the result was again averaged over a resolution length of 0·32 Å. Radial wave functions calculated by Watson (1959) for \( Mn^{2+} \) and by Hartree et al. (1939) for oxygen were used. Comparison of the projected spin density obtained from this calculation with the distribution of figure 7 suggested that its main features can be attributed to covalency. The covalency parameters \( A\sigma \) , \( A\pi \) were adjusted to reproduce these features as closely as possible. It was found that the general shape and levels of the distribution were reproduced rather well by adopting values \( A\sigma = A\pi = 0·071 \) but that they were relatively insensitive to differences between \( A\sigma \) and \( A\pi \) . This calculated distribution is shown in figure 9; it is characterized by regions of positive density at all

Figure 9. \( [1\bar{1}0] \) projection of the theoretical spin density corresponding to covalency parameters \( A\pi = A\sigma = 0.071 \) . The averaging length is 0.32 Å so the distribution may be compared directly with that in figure 7(b). The contour intervals are \( 0.1\mu_{B}\mathring{A}^{-2} \) except that a contour at \( +0.10\mu_{B}\mathring{A}^{-2} \) has also been included.
the oxygen positions whereas the observed distribution shows a small negative moment at the site of that oxygen atom which is superposed on a carbon atom in the projection. We conclude that, since all oxygen atoms are symmetrically equivalent, the small negative moment in this position must be attributed to the presence of oppositely directed spin on the carbon atom with magnitude slightly larger than the moment associated with any one oxygen atom. The present theoretical model of covalency in ionic crystals cannot account for regions of negative polarization such as that suggested by these experiments. This shows the need for a more sophisticated treatment of the problems associated with ionic complexes such as the carbonate group in magnetic salts.
Acknowledgments
We are indebted to Dr. R. Nathans who provided us with the crystal of \( MnCO_{3} \) and without whose stimulus the experiment would not have been initiated. We are grateful to him, to Drs. W. C. Marshall, W. M. Lomer and G. E. Low and to numerous colleagues who have encouraged us with helpful suggestions during the course of the work.
The programme of which this research forms a part is supported by generous grants from the Science Research Council and the United Kingdom Atomic Energy Authority Extra-Mural Research Board, to whom we express our thanks.
References
ALIKHANOV, R. A., 1959, Zh. Eksper. Teor. Fiz., 36, 1690–6 (Soviet Physics–JETP, 9, 1204–8).
BOROVIK-ROMANOV, A. S., 1959, Zh. Eksper. Teor. Fiz., 36. 766–81 (Soviet Physics–JETP, 9, 539–49).
BOROVIK-ROMANOV, A. S., and ORLOVA, M. P., 1956, Zh. Eksper. Teor. Fiz., 31, 579–82 (Soviet
Physics–JETP, 4, 531–4 (1957)).
BRAGG, W. L., 1914, Proc. Roy. Soc. A, 89, 468–89.
BROWN, P. J., and WILKINSON, C., 1965, Acta Cryst., 18, 398–400.
DZIALOSHINSKII, E. I., 1957, Zh. Eksper. Teor. Fiz., 32, 1547–62 (Soviet Physics–JETP, 5, 1259–71).
HARTREE, D. R., HARTREE, W., and SWIRLES, B., 1939, Phil. Trans. Roy. Soc. A, 238, 229–47.
HUBBARD, J., and MARSHALL, W. C., 1965, Proc. Phys. Soc., 86, 561–72.
KAPLAN, T., 1964, Phys. Rev., 136, A1636–40.
MORIYA, T., 1960, Phys. Rev., 120, 91–8.
NATHANS, R., PICKART, S. J., ALPERIN, H. A., and BROWN, P. J., 1964, Phys. Rev., 136, A1641–7.
NÉEL, L., and PAUTHENET, R., 1952, C.R. Acad. Sci., Paris, 234, 2172–4.
SHULL, C. G., and MOOK, H. A., 1966, Phys. Rev. Letters, 16, 184–6.
WATSON, R. E., 1959, Rep. Solid-St. Molec. Theory Grp M.I.T., No. 12.
WATSON, R. E., and FREEMAN, A. J., 1961, Acta Cryst., 14, 27–37.
WYKOFF, R. W. G., 1920, Amer. J. Sci., 50, 317–60.
 p10_0.jpg
 p11_0.jpg
 p3_0.jpg
 p4_0.jpg
 p5_0.jpg
 p5_1.jpg
 p7_0.jpg
 p9_0.jpg
 p9_1.jpg
 p9_2.jpg
 p9_3.jpg