| Transition Temperature | 262 K |
|---|---|
| Experiment Temperature | 10 K |
| Propagation Vector | k1 (0, 0, 0) |
| Parent Space Group | Pm-3m (#221) |
| Magnetic Space Group | R-3 (#148.17) |
| Magnetic Point Group | -3 (17.1.62) |
| Lattice Parameters | 5.49750 5.49750 6.73300 90.00 90.00 120.00 |
|---|---|
| DOI | 10.1063/1.4822023 |
| Reference | M. Wu, C. Wang, Y. Sun, L. Chu, J. Yan, D. Chen, Q. Huang and J.W. Lynn, Journal of Applied Physics (2013) 114 123902. |
| Label | Element | Mx | My | Mz | |M| |
|---|---|---|---|---|---|
| Mn1 | Mn | -2.1 | -3.3 | 0.0 | 2.89 |
Magnetic structure and lattice contraction in \( Mn_{3}NiN \)
Meimei Wu \( ^{*} \) , Cong Wang \( ^{*} \) , Ying Sun, Lihua Chu, Jun Yan, Dongfeng Chen, Qingzhen Huang, and Jeffrey W. Lynn
Citation: J. Appl. Phys. 114, 123902 (2013); doi: 10.1063/1.4822023
View online: http://dx.doi.org/10.1063/1.4822023
View Table of Contents: http://aip.scitation.org/toc/jap/114/12
Published by the American Institute of Physics
Magnetic structure and lattice contraction in \( Mn_{3}NiN \)
Meimei Wu, \( ^{1,a)} \) Cong Wang, \( ^{2,a)} \) Ying Sun, \( ^{2} \) Lihua Chu, \( ^{2} \) Jun Yan, \( ^{2} \) Dongfeng Chen, \( ^{1} \) Qingzhen Huang, \( ^{3} \) and Jeffrey W. Lynn \( ^{3} \)
\( ^{1} \) Department of Nuclear Physics, China Institute of Atomic Energy, 102413 Beijing, People's Republic of China
\( ^{2} \) Center for Condensed Matter and Materials Physics, Department of Physics, Beihang University, 100191 Beijing, People's Republic of China
\( ^{3} \) NIST Center for Neutron Research, National Institute of Standards and Technology, Gaithersburg, Maryland 20899-6102, USA
(Received 24 June 2013; accepted 9 September 2013; published online 23 September 2013)
The nuclear and magnetic structures of the cubic antiperovskite compound \( Mn_{3}NiN \) are studied using neutron powder diffraction as a function of temperature and applied magnetic field. On cooling in zero field from the paramagnetic state, an anomalous lattice expansion abruptly occurs as the long range antiferromagnetic order first develops below \( T_{N}=262 \) K. The magnetic structure has lower symmetry than the crystal and can be conveniently described by a rhombohedral R-3 symmetry with dimension of \( \sqrt{2}a_{c}\times\sqrt{2}a_{c}\times\sqrt{3}a_{c} \) , where \( a_{c} \) is the chemical unit cell. In this description, the magnetic moment of the Mn is restricted to the a-b plane, but continuously rotates from \( 90^{\circ} \) to around \( 38^{\circ} \) as the temperature decreases to \( \approx120 \) K, below which the spin directions remain fixed. The combined magnetic and structural transition exhibits a very large magnetovolume effect with an entropy change of \( \Delta S\approx54J/kg \) K, but the application of a 6T magnetic field has little effect on the magnetic structure or entropy change. The crystallographic results indicate that the properties can be tailored by small changes in the composition and site vacancies, and the results enrich the understanding of the magnetostrictive effects in antiperovskites. © 2013 AIP Publishing LLC. [http://dx.doi.org/10.1063/1.4822023]
I. INTRODUCTION
Negative thermal expansion materials have been the subject of fundamental studies because it can be used to precisely control the thermal expansion, which have much potential applications in modern technology. \( ^{1-3} \) The Mn-based \( Mn_{3}AX \) (A = Zn, Ga, Sn, Ni; X = N or C) compounds with the antiperovskite structure have attracted considerable attention for their interesting negative or zero thermal expansion (NTE), abnormal electronic transport, magnetostriction, and magnetocaloric effect. \( ^{4-13} \) In this system, the NTE effect is closely correlated with the magnetic ordering transition. Thus, the determination of the magnetic structure is a critical step to understand the NTE properties.
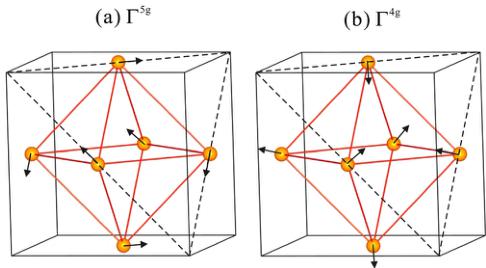
\( Mn_{3}NiN \) has been investigated previously, with the Mn moments undergoing a paramagnetic (PM) to antiferromagnetic (AFM) transition at about \( T_{N} \sim 266 K \) . \( ^{14,15} \) Fruchart et al. \( ^{15} \) first reported that \( Mn_{3}NiN \) exhibits a magnetic structure with a combination of \( \Gamma^{5g} \) and \( \Gamma^{4g} \) symmetries (shown in Fig. 1) from \( T_{N} \) to 180 K, where the moments rotate in the (111) plane within a total angle of \( 90^{\circ} \) . Below 180 K, the \( \Gamma^{5g} \) symmetry is stabilized. However, a combination of \( \Gamma^{4g} \) and \( \Gamma^{5g} \) antiferromagnetic structures between 10 K and \( T_{N} \) was reported by Kodama et al. \( ^{16} \) It was suggested that this different magnetic behavior originated from differences in sample composition, such as a small difference in nitrogen content.
We previously reported \( ^{17} \) on the measured negative thermal expansion properties determined by variable temperature X-ray diffraction and low temperature coefficient of resistance (L-TCR) data. However, the relationship between the NTE and the magnetic structure was unclear. To obtain a comprehensive understanding of the correlation between the structure and NTE behavior, we have determined the crystal and magnetic structures of our sample using temperature dependent neutron powder diffraction (NPD).
II. EXPERIMENTS
The sample was prepared by solid-state reaction in vacuum with \( Mn_{2}N \) and Ni powders as starting materials according to the detailed preparation method described in Ref. 17. Differential scanning calorimetry (DSC) measurements were conducted using Netzen thermal equipment at 200 K to 300 K. NPD data were collected at 10 K to 300 K with the high-resolution neutron powder diffractometer (BT-1) at the NIST Center for Neutron Research (NCNR). A Cu (311) monochromator was used to produce monochromatic neutron beams with a wavelength of 1.5403 Å. Collimators with horizontal divergences of 15', 20', and 7' full-width-at-half-maximum (FWHM) were used before and after the monochromator and after the sample, respectively. NPD data were collected with a step of 0.05° in the 2θ range of 3°–168° to determine the crystal and magnetic structures and elucidate thermal expansion properties. To investigate possible magnetic-field-induced phase transitions, magnetic field measurements were carried out on BT-1 at 264 K with a vertical field superconducting magnet with a maximum field of 7 T. The nuclear and magnetic structures were determined via the Rietveld method with the General Structure Analysis System (GSAS) software. \( ^{18} \) The neutron scattering lengths used in the refinements were -0.375, 1.030, and 0.936 ( \( \times10^{-12} \) cm) for Mn, Ni, and N,

FIG. 1. (a) \( \Gamma^{5g} \) and (b) \( \Gamma^{4g} \) antiferromagnetic structures.
respectively. The intensity of the strong magnetic Bragg peaks (1 0 0) was monitored as a function of temperature using the BT-9 high intensity triple-axis spectrometer at the NCNR. A pyrolytic graphite (002) monochromator was employed at a wavelength of 2.359 Å along with a pyrolytic graphite filter to suppress higher order wavelength contaminations. Collimators with horizontal divergences of 40', 46', and 40' FWHM were used.
III. RESULTS AND DISCUSSIONS
\( Mn_{3}NiN \) is in the paramagnetic phase at 300 K, which provides the best opportunity to refine atom occupancies. The antiperovskite structure has cubic symmetry with space group \( Pm\bar{3}m \) (No. 221). The indexing of NPD peaks indicates the presence of two impurity phases, one of which is identified as MnO (cubic symmetry with space group \( Fm\bar{3}m \) ) and the other is NiMn (tetragonal symmetry with space \( P4/mmm \) ). For the \( Mn_{3}NiN \) phase, the initial atomic positions and unit cell parameters used in the refinement were based on previous reports, \( ^{[14,19]} \) with the Mn atoms located in 3c (0, 0.5, 0.5) sites, Ni in 1a (0, 0, 0) sites, and N in 1b (0.5, 0.5, 0.5) sites. Refining the Mn, Ni, and N occupancies together yielded the refined value of Mn is 1.00(1), while those of Ni and N were lower than 1.00. The occupancy of Mn was then fixed to 1.00 in subsequent refinements. The refined occupancies of Ni and N were found to be 0.90(1) and 0.96(1) (referred to as model 1), indicating possible vacancies at the 1a and 1b sites. However, the possible presence of Mn at the 1a site would require the Ni occupancy to deviate from full occupancy. With the negative neutron scattering length of Mn and assuming the 1a site is fully occupied, the refined occupancies of Ni/Mn are 0.93(1)/0.07(1) [model 2]. The quality of fits for the two models did not show a statistically significant difference. A further complication can occur if this site is not fully occupied. For example, if we have a 10% vacancy at the 1a site the refined neutron scattering length at this site would be
\[ b(1a site)=b(Ni)\times0.90=0.927,or \]
\[ \begin{aligned}b(1a site)&=x\times b(Ni)+y\times b(Mn)+z\times b(vacancy)\\&=0.927,\end{aligned} \]
where \( b(\mathrm{Mn}) = -0.375 \) , \( b(\mathrm{Ni}) = 1.03 \) , and \( b(\mathrm{vacancy}) = 0 \) ( \( \times 10^{-12} \) cm) and x, y, and z are occupancy parameters at 1a
TABLE I. Refined structural parameters of \( Mn_{3}NiN \) at 300 K. Space group \( Pm\bar{3}m \) (No. 221). Atomic positions: Mn: 3c (0, 1/2, 1/2); Ni: 1a (0, 0, 0); N: 1b (1/2, 1/2, 1/2).
| Atoms and structural parameters | ||
| a( \( \textup{\AA} \) ) | 3.88732(3) | |
| V( \( \textup{\AA}^{3} \) ) | 58.742(1) | |
| Phase fraction (wt. %) | Mn \( _{3} \) NiN | 94.02% |
| MnO | 1.75% | |
| NiMn | 4.23% | |
| Mn | n | 1.00 |
| u11 | 0.37(8) | |
| u22 = u33 | 1.91(6) | |
| Ni \( ^{1} \) | n | 0.90(1) |
| B \( _{\text{iso}} \) | 1.21(3) | |
| Ni/Mn \( ^{2} \) | n | 0.93(3)/0.07(3) |
| N | n | 0.96(1) |
| B \( _{\text{iso}} \) | 0.78(3) | |
| Rp(\%) | 5.49 | |
| Rwp(\%) | 6.93 | |
| \( \chi^{2} \) | 1.298 | |
| Ni-Mn | 2.74875(1) | |
| Mn-N | 1.94366(1) | |
| Ni-N | 3.6632 (2) | |
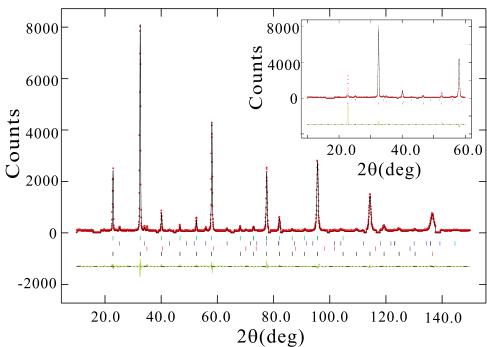
site for Ni, Mn, and vacancy, respectively. In this case, the chemical formula would be \( Mn_{3}Ni_{x}Mn_{3}(Vacancy)_{2}N_{0.96} \) , where \( x + y + z = 1 \) . In the case of z = 0, the formula would be \( Mn_{3}Ni_{0.93}Mn_{0.07}N_{0.96} \) . If the site were occupied by a mixture of Ni, Mn, and vacancy, the Ni content can be any number from a minimum of 0.90 to a maximum of 0.93. The refined atomic parameters are given in Table I. Fig. 2 shows the plot of observed and calculated intensity profiles at 10 K. The diffraction peaks from the Al sample holder were excluded in the analysis. The inset shows the observed and calculated intensities for the nuclear structure only, so that the magnetic peaks can be easily identified.

FIG. 2. Plot of the observed and calculated intensity profiles at 10 K. The vertical lines indicate the angular positions of \( Mn_{3}NiN \) nuclear (top row) and magnetic (bottom row), MnO (second row), and NiMn (third row) Bragg reflections. The lowest part of the figure shows the difference between observed and calculated intensities. The plot in the inset shows the observed and calculated intensities for the nuclear structure only, so the magnetic contribution can be visible in the difference plots at the bottom.


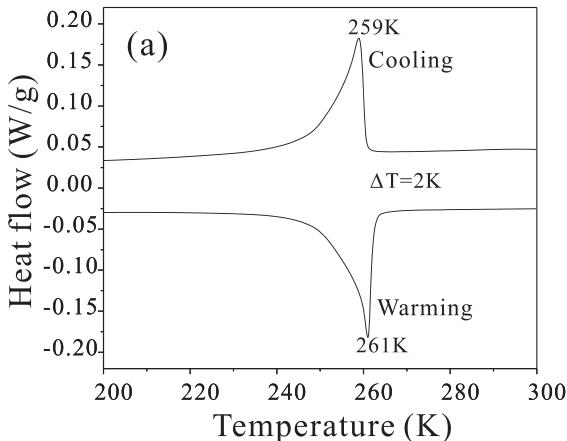
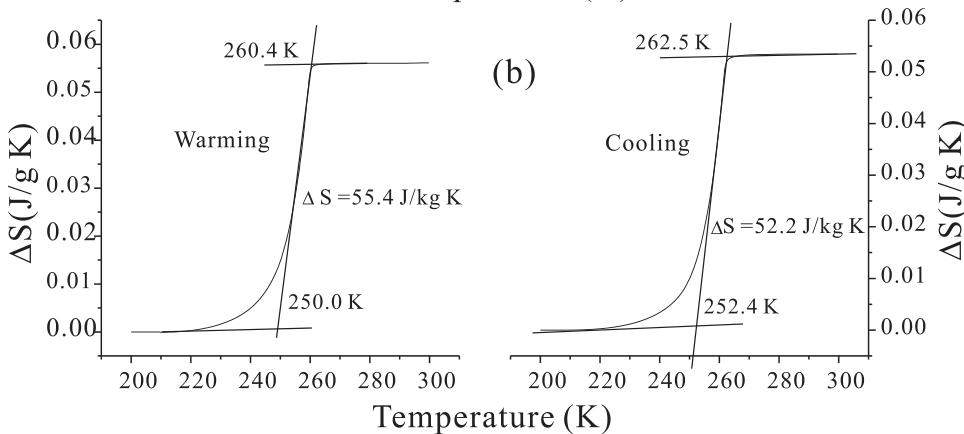
FIG. 3. (a) DSC curves and (b) entropy change on warming and cooling.
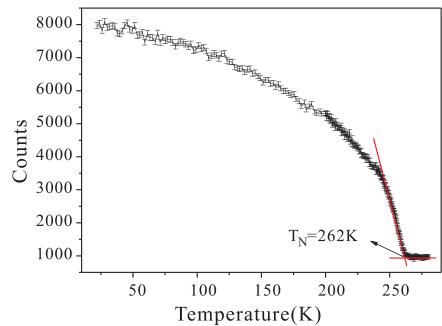
The DSC measurement indicates a phase transition at 259 K during cooling and at 261 K during heating, which shows only a very little thermal hysteresis of 2.0 K (Fig. 3(a)). The obvious endothermic or exothermic peaks upon heating or cooling indicate the first-order nature of the phase transition of the sample. It is worth noting that there are very large entropy changes associated with \( T_{N} \) , with \( \Delta S = 55.4 J/kg K \) on warming and 52.2 J/kg K on cooling (Fig. 3(b)). The large \( \Delta S \) in \( Mn_{3}NiN \) may be attributed to the sharp change in the lattice/magnetic structure in the vicinity of \( T_{N} \) . We also investigated the intensity of the reflection peak (100) as a function of temperature using the BT-9 triple-axis spectrometer, and the data are shown in Fig. 4. We note that the magnetic intensity is proportional to the square of the ordered moment. The transition temperature is determined to be 262 K, consistent with the DSC results.
With the very large entropy changes found in \( Mn_{3}NiN \) , this material might be a viable magnetocaloric material if

FIG. 4. Temperature dependence of the (100) magnetic Bragg reflection.
these can be obtained with the application of a modest magnetic field. To investigate this possibility, NPD data were collected at 264 K (slightly above the magnetic transition temperature) on BT-1 with the magnetic field increasing from 0 T to 6 T. However, the crystal and magnetic structures only slightly changed at the higher magnetic fields. Since the magnetic field had minimal effect to convert the paramagnetic phase to the magnetic phase, it is clear that \( Mn_{3}NiN \) is antiferromagnetic. We note that if Ni carried a magnetic moment, the system should be expected to exhibit a net magnetization (ferromagnetic (FM) component). The present results contradict this hypothesis, consistent with Fruchart and Bertaut. \( ^{14} \)
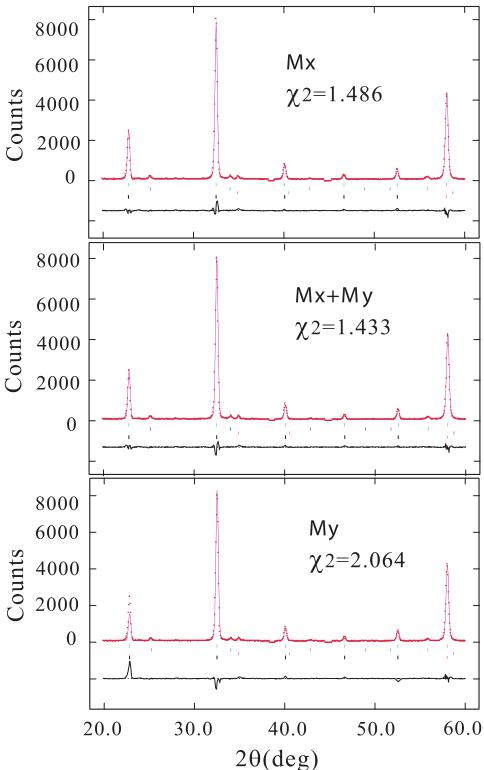
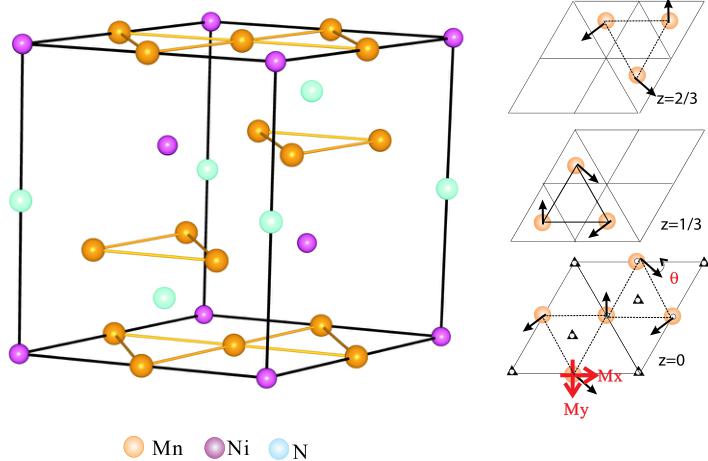
Since all the magnetic reflections coincide with the nuclear ones, the magnetic model can be built based on propagation vector \( \kappa=(0\ 0\ 0) \) . The possible models have been proposed by Fruchart et al., \( ^{14,15} \) which are composed of a linear combination of the irreducible representations (IR) \( \Gamma^{4g} \) (ferro- and antiferro-) and \( \Gamma^{5g} \) (antiferro-). Both IRs do not possess cubic symmetry for the spin arrangement. For convenience in refining the magnetic structure using GSAS, a rhombohedral R-3 symmetry with dimension of \( \sqrt{2}a_{c} \times \sqrt{2}a_{c} \times \sqrt{3}a_{c} \) was used as the magnetic unit cell (Fig. 6), where the \( a_{c} \) is the nuclear lattice parameters of the unit cell. In this setting, the Mn magnetic moment can be placed in the a-b plane and/or along the c direction. The Mz component on the Mn atom also forms a FM component because of the hexagonal symmetry. Therefore, the magnetic moment should be in the a-b plane with three possible directions, along a, b, or \( a+b \) directions. During the \( Mx/My/Mx+My \) refinement, the corresponding \( My+Mz/Mx+Mz/Mz \) components were fixed to zero and the magnetic moment was varied. The results with different Mn magnetic moment directions at 10 K are shown in Fig. 5. If the Mn moment has only an Mx or My component, the goodness of fit \( \chi^{2} \) is larger than that with Mx and My components. The same observation was obtained for all refinements by using the data collected at different temperatures below the magnetic transition temperature \( T_{N}=262 \) K. Therefore, the model of a moment having both Mx and My components was adapted in the following discussion. The magnetic structure model is shown in Fig. 6.
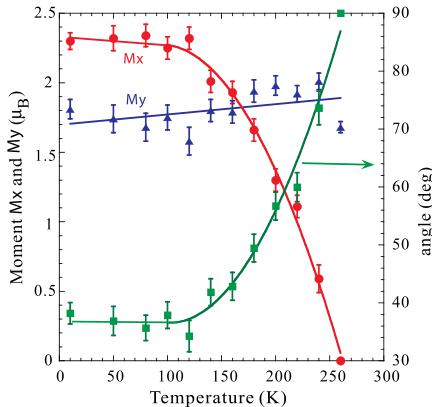
Fig. 7 shows the variations of the magnetic moments Mx and My and angle \( \theta \) ( \( \theta \) is defined as the angle between the magnetic moment and the a axis) with temperature. Mx is constant from 10 K to 120 K, and then decreases to zero. My remains almost unchanged in this entire temperature range. The angle \( \theta \) remains at approximately \( 38^{\circ} \) below 120 K and then increases up to \( 90^{\circ} \) at 260 K. The magnetic structure of our sample is similar to that reported in Ref. 15. Fruchart et al. also found a rotation of the magnetic moments in the (111) plane through a total angle of \( 90^{\circ} \) at 180 K to \( T_{N} \) . However, the rotation happens between 120 K and \( T_{N} \) in our case. These different magnetic properties may be attributed to the slight differences in composition and content at the Ni or N site, and indicates that these properties may be tailored by varying and controlling the composition.
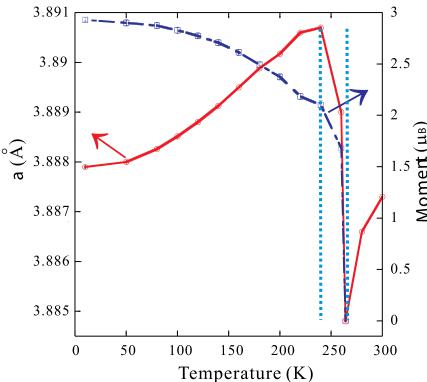
The temperature dependence of the ordered magnetic moment and cell parameter a is shown in Fig. 8. With

FIG. 5. Rietveld refinement results at 10 K with different Mn magnetic moments. \( Mx, Mx + My \) , and My indicate that the moment direction is placed along the \( x, x + y \) , and y directions, respectively.
increasing temperature, the cell parameter a exhibits a typical thermal variation, with the moment slowly decreasing as spin excitations are thermally activated in the system. Then the ordered moment suddenly drops rapidly when the system transforms to the paramagnetic state via the first-order transition. Coincident with the magnetic transition is an anomalous variation of the cell parameter a between 264 and 240 K ( \( \Delta T = 24 K \) ), where the linear coefficient of thermal expansion (CTE) \( \alpha_{I} \) was \( -6.328 \times 10^{-5} \, K^{-1} \) . The abrupt jump of the lattice indicates the close correlation between the anomalous lattice variation and the magnetic ordering, consistent with previous physical property measurements. \( ^{[17]} \) This magnetovolume effect (MVE) originates from coupling of the \( \Gamma^{5g} \) antiferromagnetic spin structure with the cubic crystal structure, where the \( \Gamma^{5g} \) ordered moment results in geometrical frustration and volume expansion. \( ^{[9,11,16]} \) Below \( \approx 240 K \) , normal thermal expansion is restored, along with the typical increase in the ordered magnetic moment. The anomalous thermal expansion in antiperovskite \( Mn_{3}AX \) compounds results from a competition between the MVE and normal thermal expansion. \( ^{[5]} \) When magnetic-induced volume expansion is dominant, anomalous thermal expansion occurs, and

FIG. 6. Magnetic structure with the magnetic moments aligned in the a-b plane.

FIG. 7. Thermal variations of \( M_{x} \) , \( M_{y} \) and the angle \( \theta \) .

FIG. 8. Temperature dependence of the cell parameter a and total magnetic moment.
when the MVE reaches saturation, the thermal expansion reverts to normal behavior. CTEs were \( 4.041 \times 10^{-6} \) in the low temperature regime and \( 1.788 \times 10^{-5} \) K \( ^{-1} \) in the paramagnetic state. But note the abnormal behavior that the lattice parameter a in the regime 10 K–240 K is larger than above \( T_{N} \) . This overall volume expansion can be attributed to the MVE originating from the magnetic ordering.
IV. CONCLUSION
In summary, we have investigated the magnetic and nuclear structures of \( Mn_{3}NiN \) using NPD. The magnetic structure can be conveniently described using the space group R-3, where the magnetic moment directions of the Mn atoms reside in the a-b plane. The moments undergo a large rotate in this plane for the temperature range 120 K–260 K. The lattice exhibits large negative thermal expansion when the magnetic order develops at \( T_{N} \approx 264 \) K to \( \approx 240 \) K, demonstrating that the anomalous thermal expansion originates from the spin ordering. This coupled behavior results in a large entropy change \( \Delta S = 55.4 \) J/kg K in the vicinity of the magnetic transition temperature point \( T_{N} \) .
ACKNOWLEDGMENTS
The project was supported by National Natural Science Foundation of China (NSFC) (Nos. 51172012 and 91122026). The authors thank D. A. Neumann and A. Santoro (NIST) for very constructive discussions. The identification of any commercial product or trade name does not imply endorsement or recommendation by NIST.
\( ^{5} \) C. Wang, L. H. Chu, Q. R. Yao, Y. Sun, M. M. Wu, L. Ding, J. Yan, Y. Y. Na, W. H. Tang, G. N. Li, Q. Z. Huang, and J. W. Lynn, Phys. Rev. B 85, 220103 (2012).
\( ^{6} \) K. Takenaka and H. Takagi, Appl. Phys. Lett. 94, 131904 (2009); 87, 261902 (2005).
\( ^{7} \) X. Y. Song, Z. H. Sun, Q. Z. Huang, M. Rettenmayr, X. M. Liu, M. Seyring, G. N. Li, G. H. Rao, and F. X. Yin, Adv. Mater. 23, 4690 (2011).
\( ^{8} \) Y. Sun, C. Wang, Y. C. Wen, K. G. Zhu, and J. T. Zhao, Appl. Phys. Lett. 91, 231913 (2007).
\( ^{9} \) S. Iikubo, K. Kodama, K. Takenaka, H. Takagi, M. Takigawa, and S. Shamoto, Phys. Rev. Lett. 101, 205901 (2008).
\( ^{10} \) Y. B. Li, W. F. Li, W. J. Feng, Y. Q. Zhang, and Z. D. Zhang, Phys. Rev. B 72, 024411 (2005).
\( ^{11} \) S. Iikubo, K. Kodama, K. Takenaka, H.Takagi, and S. Shamoto, Phys. Rev. B 77, 020409 (2008).
\( ^{12} \) B. S. Wang, P. Tong, Y. P. Sun, W. Tang, L. J. Li, X. B. Zhu, Z. R. Yang, and W. H. Song, J. Magn. Magn. Mater. 322, 163 (2010).
\( ^{13} \) K. Asana, K. Koyama, and K. Takenaka, Appl. Phys. Lett. 92, 161909 (2008).
\( ^{14} \) D. Fruchart and E. F. Bertaut, J. Phys. Soc. Jpn. 44, 781 (1978).
\( ^{15} \) D. Fruchart, E. F. Bertaut, R. Madar, G. Lorthioir, and R. Fruchart, Solid State Commun. 9, 1793 (1971).
\( ^{16} \) K. Kodama, S. Iikubo, K. Takenaka, M. Takigawa, H. Takagi, and S. Shamoto, Phys. Rev. B 81, 224419 (2010).
\( ^{17} \) Y. Sun, C. Wang, L. H. Chu, Y. C. Wen, M. Nie, and F. S. Liu, Scr. Mater. 62, 686 (2010).
\( ^{18} \) A. C. Larson and R. B. Von Dreele, General Structure Analysis System (GSAS), Los Alamos National Laboratory Report, LAUR 86-748 (2004).
\( ^{19} \) D. Fruchart, E. F. Bertaut, R. Madar and R. Fruchart, J. Phys. Colloques 32, C1-876 (1971).
 p3_0.jpg
 p3_1.jpg
 p4_0.jpg
 p4_1.jpg
 p4_2.jpg
 p5_0.jpg
 p6_0.jpg
 p6_1.jpg
 p6_2.jpg