| Transition Temperature | 15 K |
|---|---|
| Parent Space Group | Fd-3m (#227) |
| Magnetic Space Group | I41'/a'm'd (#141.556) |
| Magnetic Point Group | 4'/m'm'm (15.5.57) |
| Lattice Parameters | 7.04300 7.04300 7.04300 90.00 90.00 90.00 |
|---|---|
| DOI | 10.1103/physrevb.11.530 |
| Reference | A.T. Aldred, B.D. Dunlap, D.J. Lam, G.H. Lander, M.H. Mueller and I. Nowik, Physical Review B (1975) 11 530-544. |
| Label | Element | Mx | My | Mz | |M| |
|---|---|---|---|---|---|
| Np1 | Np | 0.0 | 0.0 | 0.5 | 0.50 |
Magnetic properties of neptunium Laves phases: \( NpMn_{2} \) , \( NpFe_{2} \) , \( NpCo_{2} \) , and \( NpNi_{2} \)
A. T. Aldred, B. D. Dunlap, D. J. Lam, G. H. Lander, M. H. Mueller, and I. Nowik* Argonne National Laboratory, Argonne, Illinois 60439 (Received 12 August 1974)
The magnetic properties of the cubic Laves phases (C-15 structure) \( NpMn_{2} \) , \( NpFe_{2} \) , \( NpCo_{2} \) , and \( NpNi_{2}\) have been studied from 4 to 300 K by means of magnetization, neutron-diffraction, and nuclear-y-ray resonance (Mössbauer) experiments. The respective ordering temperatures (and types of ordering) are 18 K (ferro), \( \sim \) 500 K (ferro), 15 K (antiferro), and 32 K (ferro). Magnetic moments are present on the neptunium atoms in all compounds with values varying from \( 1.2\mu_{B} \) in \( NpNi_{2} \) to \( 0.3\mu_{B} \) in \( NpMn_{2} \) . On the transition-metal site, only the iron atom carries a magnetic moment in zero field; in high magnetic fields, a small moment of \( \sim0.2\mu_{B} \) is observed on the manganese atom. No simple correlation appears to exist among the values of the magnetic moments, the Np-Np distance, and the ordering temperature. A feature of the data is the large high-field susceptibility in the ferromagnetic compounds at low temperatures. Some magnetic properties, such as the large anisotropy ( \( \langle111\rangle \) is the easy axis) and the linear relationship between the hyperfine field and the neptunium magnetic moment, are best interpreted in terms of localized 5f electrons on the actinide ion, whereas other properties, such as the low values of the neptunium moments and the high-field susceptibility, suggest strong hybridization between the 5f and 3d electrons.
I. INTRODUCTION
The actinide cubic Laves phases form a fertile field for the study of magnetism. In intermetallic compounds, Hill \( ^{1} \) showed that critical actinide-actinide spacings exist beyond which magnetic order is found, and some of the actinide Laves phases fall in this region. Of the uranium Laves phases studied, only \( UFe_{2} \) orders ferromagnetically, although the magnetic moments reside almost entirely on the iron sites. \( ^{2} \) Some evidence suggests that \( UMn_{2} \) may undergo an antiferromagnetic transition. \( ^{3} \) In the plutonium Laves phases, nuclear- \( \gamma \) -ray-resonance (NGR or Mössbauer-effect) measurements have shown that \( PuFe_{2} \) is ferromagnetic at room temperature with a hyperfine field associated with the iron sites, and magnetization results \( ^{4} \) indicate that \( PuPt_{2} \) orders ferromagnetically at 6 K. Magnetic ordering is somewhat more widespread in the neptunium Laves phases. Previous NGR studies have shown that hyperfine fields occur at the iron sites in \( NpFe_{2} \) , \( ^{5,6} \) and at the neptunium sites in \( NpFe_{2} \) , \( NpCo_{2} \) , \( NpNi_{2} \) , \( NpIr_{2} \) , and \( NpAl_{2} \) . \( ^{7} \)
In a recent study, \( ^{8} \) we have shown the regular variation in magnetic properties of the neptunium Laves phases \( NpAl_{2} \) , \( NpOs_{2} \) , \( NpIr_{2} \) , and \( NpT_{2} \) . This variation is correlated with the neptunium-neptunium distance \( d_{Np} \) and interpreted in terms of an increase in the delocalization of the 5f electrons as \( d_{Np} \) decreases. In \( NpT_{2} \) , which has the smallest \( d_{Np} \) value of the four compounds listed above, the delocalization is such that no ordered magnetic moment can be sustained. The neptunium Laves phases that form the subject of the present study ( \( NpFe_{2} \) , \( NpNi_{2} \) , \( NpCo_{2} \) , and \( NpT_{2} \) ) have \( d_{Np} \) values even lower than that of \( NpT_{2} \) . However, all the compounds order magnetically, and the magnetic properties are obviously influenced by the 3d transition-metal partners. To elucidate the magnetic behavior of these compounds, we have made a series of bulk-magnetization, neutron-diffraction, and NGR measurements at the Np site in the temperature range 4–300 K.
II. EXPERIMENTAL
The sample preparation techniques have been given previously. \( ^{8} \) All magnetization and NGR samples were prepared from the same batch of high-purity neptunium, except for \( NpCo_{2} \) , which was made from a batch of neptunium containing several hundred parts per million of carbon. The influence of the carbon-impurity content on the magnetic properties will be considered later. The larger neutron-diffraction samples were also made from neptunium of lower purity that was available in larger quantities.
To characterize the samples in some detail, both x-ray and neutron patterns were taken at room temperature. Additional diffraction lines (identified as arising from \( NpO_{2} \) ) were present only in the case of \( NpMn_{2} \) . An unusual feature of the two highest-angle lines ( \( \sqrt{72} \) and \( \sqrt{75} \) ) in the x-ray pattern (Cu radiation) of \( NpFe_{2} \) is the splitting of the lines into more than one component. As will be discussed, \( NpFe_{2} \) is ferromagnetic at room temperature, and the easy direction of magnetization is \( \langle111\rangle \) . On the basis of our examination of a number of actinide ferromagnets with low-temperature x-ray techniques, we expect a rhombohedral distortion of the chemical unit cell below

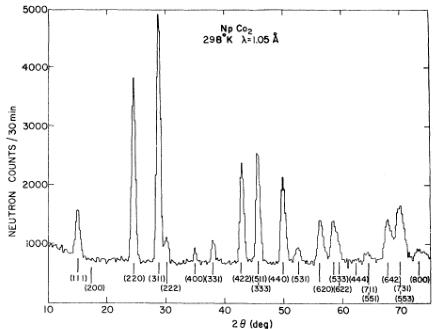
FIG. 1. Neutron-diffraction pattern of \( NpCo_{2} \) at room temperature.
the Curie temperature. \( ^{9} \) Such a distortion results, of course, in a splitting of the high-angle diffraction lines—the effect observed in the patterns from the \( NpFe_{2} \) sample. A more quantitative analysis of the distortion, as well as positive identification of its rhombohedral nature, is planned using diffractometer techniques.
The neutron-diffraction results have been used to determine (a) the degree of atomic order in the Np-Laves-phase structure, (b) the magnetic structure, and (c) the magnetic moments on the neptunium and transition-metal atoms. The achievement of these goals is more difficult than might be expected because of the limited quantities of material available (2–3 g) for neutron experiments and the small magnetic moments anticipated from the initial results of NGR and magnetization experiments. For (a), high-resolution powder patterns were taken at room temperature, and the integrated intensities, corrected for effects of absorption and magnetic scattering ( \( NpFe_{2} \) only), were used to obtain the atomic parameters in the usual manner. A typical neutron pattern is shown in Fig. 1, and the results of the least-squares analysis for each compound are summarized in Table I. The important parameter in the refinement is the scattering length at the transition-metal site. We have kept the scattering length at the neptunium site fixed in all cases. Attempts to use individual temperature factors in the refinements gave no significant improvement in the residual R, defined as
\[ R=\sum w(|N_{0}-|N_{c}|)\Big/\sum|N_{c}|, \]
where \( N_{0} \) is the observed nuclear structure factor of weight \( w = (1/\sigma^{2}) \) , \( N_{c} \) is the calculated structure factor, and the sum is over all reflections. All residuals are low, which indicates agreement between \( N_{0} \) and \( N_{c} \) , and the temperature factors are reasonable. Except for \( NpCo_{2} \) , the values of \( b_{tm} \) , the scattering potential at the transition-metal site, are in good agreement with the published values, \( ^{10} \) During the low-temperature experiments on the same sample of \( NpCo_{2} \) with a different diffractometer and neutron wavelength (1,2 Å), the integrated intensities were again refined, giving a value of \( b_{co} = 0.293(15) \) , in agreement with the value of 0,315(6) in Table I. The disagreement between the published value of \( b_{co} = 0.250 \) and that obtained in our study of \( NpCo_{2} \) is further discussed in Sec. III D. To determine (b) and (c) above, a series of neutron experiments with both polarized and unpolarized neutrons have been performed. In particular, the use of polarized neutrons with a superconducting magnet ( \( H_{max} = 60kOe \) ) allows us to study details of the magnetic behavior that would be impossible with unpolarized neutrons and small samples. The use of high magnetic fields also permits a determination of the easy direction of magnetization from the diffraction experiments. Normally this information cannot be determined unless single crystals are available.
TABLE I. Results of least-squares analyses of unpolarized-neutron experiments on Np Laves phases. The Np scattering length has been fixed at 1.055 × 10^{-12} cm. b_{tm} represents the scattering length at the transition-metal site. Numbers in parentheses in all tables refer to the standard deviation of the least significant digit.
| Parameters | NpCo2 | NpNi2 | NpFe2 | NpMn2 |
| Lattice constant (Å) | 7.043 | 7.098 | 7.144 | 7.230 |
| Sample weight (g) | 2.80 | 2.40 | 3.22 | 2.41 |
| Temperature (°K) | 298 | 80 | 298 | 298 |
| Wavelength (Å) | 1.050 | 1.211 | 1.050 | 1.050 |
| Number of reflections | 16 | 9 | 15 | 16 |
| Over-all temperature factor (Å2) | 0.947(7) | 0.82(2) | 1.22(2) | 0.85(10) |
| bTm(10−12cm) | 0.315(6) | 1.06(2) | 0.98(2) | −0.372(15) |
| Published bTm | 0.250 | 1.030 | 0.951 | −0.387 |
| R | 0.018 | 0.023 | 0.024 | 0.023 |

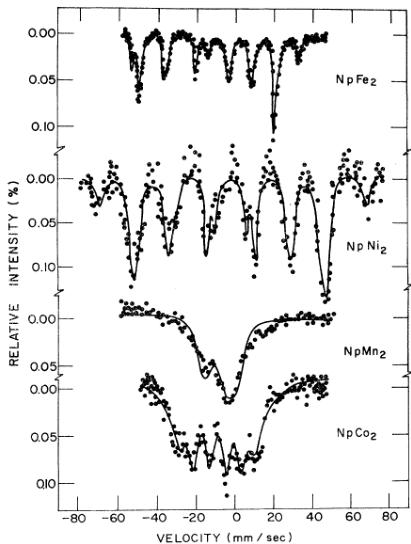
FIG. 2. Nuclear-γ-ray spectra of \( NpFe_{2} \) , \( NpNi_{2} \) , \( NpMn_{2} \) , and \( NpCo_{2} \) at 4.2 K.
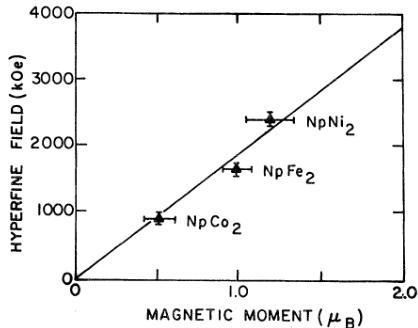
The experimental techniques used in the magnetization and NGR measurements were described previously. \( ^{8} \) The NGR spectra taken for the four compounds at 4.2 K are shown in Fig. 2. For \( NpFe_{2} \) , \( NpNi_{2} \) and \( NpCo_{2} \) , the spectra obtained are similar to those given by Gal et al. \( ^{7} \) The solid lines in Fig. 2 show the results of least-squares fits to the data, assuming magnetic hyperfine fields \( (H_{\mathrm{ht}}) \) commensurate with axial electric quadrupole couplings \( (e^{2}qQ) \) . In the case of \( NpCo_{2} \) , it was necessary to allow different transitions to have different linewidths, similar to the procedure adopted by Gal et al. \( ^{7} \) The additional intensity visible in the \( NpMn_{2} \) spectrum at \( \sim8~mm/sec \) is attributed to the \( NpO_{2} \) impurity discussed above. The hyperfine coupling parameters are given in Table II. For comparison, the \( H_{ht} \) values from Gal et al. \( ^{7} \) are also given. We have found a simple linear relation between the magnetic hyperfine field and the magnetic moment at the neptunium site \( (\mu_{\mathrm{Np}}=5.2\times10^{-4}H_{\mathrm{ht}}) \) , and in subsequent discussion we will assume the same relationship holds (see Sec. IV and Fig. 15).
III. RESULTS
A. NpFe_{2}
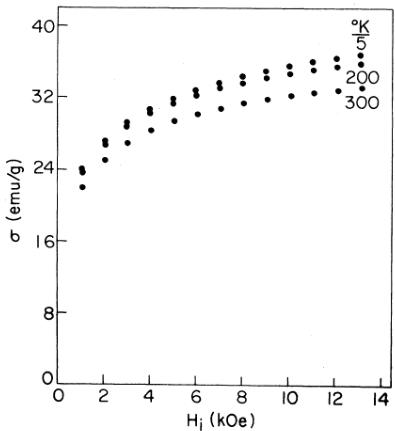
The compound \( NpFe_{2} \) is ferromagnetic at room temperature, and the magnetization curves at 5 and 300 K (Fig. 3) are essentially the same, except for a small displacement; slightly more field dependence occurs at 5 than at 300 K. The large field dependence (the magnetization \( \sigma \) increases by \( \sim26\% \) between 3 and 13 kOe) presumably reflects the presence of magnetocrystalline anisotropy, although the approach to saturation is much slower than the \( H^{\alpha2} \) dependence that is valid for a normal polycrystalline ferromagnet, \( ^{11} \) This slow approach to saturation is typical of actinide ferromagnets \( ^{8} \) and makes a reliable extrapolation to saturation rather uncertain. The maximum moment at 5 K and 13 kOe is \( 2.30\mu_{B}/mole \) . The magnetization changes by \( \sim11\% \) between 5 and 300 K at the highest field. Gal et al. \( ^{7} \) found that the temperature dependence of the hyperfine field in the other neptunium Laves phases follows a \( J=\frac{1}{2} \) Brillouin curve, and, on this basis, the Curie temperature \( T_{C} \) of \( NpFe_{2} \) is \( \sim500 \) K.
Because of the high Curie temperature of \( NpFe_{2} \) , the usual technique of obtaining neutron-diffraction patterns in the paramagnetic and ordered states would require a furnace for radioactive samples. Initially, we collected accurate integrated intensities as far as the (800) reflection \( \left[\sin\theta/\lambda=0.56\ \mathring{\mathrm{A}}^{-1}\right] \) and refined only the high-angle data \( \left[\sin\theta/\lambda>0.4\ \mathring{\mathrm{A}}^{-1}\right] \) , inasmuch as the magnetic scattering will be small for this angular range. The intensities at low angles were then calculated and subtracted from the observed intensities; the differences were assumed to arise from magnetic scattering. Because of the experimental uncertainties, this process was not quantitatively successful. However, the method did indicate magnetic moments on the Np and Fe atoms of \( \sim1.3\mu_{B} \) and \( \sim0.9\mu_{B} \) , respectively.
In an effort to improve on the results obtained with unpolarized neutrons, an experiment was attempted in the polarized-neutron diffractometer. This instrument \( ^{12} \) is designed to measure accu-
TABLE II. Values for magnetic hyperfine field \( H_{ht} \) , electric quadrupole coupling \( e^{2}qQ \) , and isomer shift of \( {}^{237}Np \) in Np Laves phases.
| Parameters | NpFe2 | NpNi2 | NpMn2 | NpCo2 |
| Hht(kOe)a | 1670 | 2350 | ~400 | 980 |
| 1660b | 2300b | 1000b | ||
| e2qQ(10-7eV)b | 29 | 10 | 17 | 5 |
| Isomer shift (mm/sec)d | -23 | -17 | -24 | -22 |
\( ^{a} \) Errors are \( \pm100 \) kOe. All results are given for 4.2 K except for \( NpCo_{2} \) , where the saturation value has been extrapolated from a 4.2-K measurement of 905 kOe.
\( ^{b}H_{ht} \) obtained from Gal. et al. (Ref. 7).
\[ e_{\pm}2\times10^{-7}eV. \]
\( d_{\pm}1\ mm/sec. \) Values are with respect to \( NpAl_{2} \)

FIG. 3. Magnetization \( \sigma \) vs internal field \( H_{i} \) for \( NpFe_{2} \) at 5, 200, and 300 K. The internal field is determined by subtracting an appropriate demagnetizing field, based on sample geometry, from the applied field H.
rately the magnetic scattering, but is normally used with single crystals. The intensity of the polarized-neutron beam is at least an order of magnitude less than the unpolarized beam, so that large samples are usually required for meaningful experiments on powders. For a ferromagnetic material, the neutron cross section for unpolarized neutrons is proportional to \( N^{\beta} + \frac{2}{3} M^{\beta} \) , where N and M are the nuclear and magnetic structure factors, respectively. For polarized neutrons, the intensity I, with the neutrons polarized parallel to the applied field is proportional to \( (N + M)^{\beta} \) , and with the reverse polarization state, the intensity I, is proportional to \( (N - M)^{\beta} \) . Polarized-neutron experiments commonly determine the ratio of these two intensities \( I_{u}/I_{c} = R = (N + M)^{\beta}/(N - M)^{\beta} \) , from which the ratio \( \gamma = M/N \) can be determined. In practice, small corrections must be made for incomplete neutron polarization and flipping efficiency, both 99.3% in this case. (Depolarization is discussed separately below.) These corrections have been made throughout but are omitted in the presentation for the sake of clarity. To illustrate the sensitivity of the polarized-beam technique, let us evaluate the intensity ratio of the two spin states for the (220) reflection. The nuclear structure factor N consists of contributions from neptunium atoms only, \( N(220) = b_{Np} = 1.055 \) (all structure factors are in units of \( 10^{-12} \) cm). The magnetic structure factor \( M(220) = 0.2696 \mu_{Np} f_{Np} \) ; if \( \mu_{Np} = 1.0 \mu_{B} \) and the form factor \( f_{Np} = 0.84 \) , then \( M(220) = 0.226 \) . With unpolarized neutrons, the ferromagnetic intensity is \( \frac{2}{3} M^{\beta} = (0.034) \) in addition to a nuclear intensity of \( N^{\beta} = (1.113) \) , i.e., an increase of 3%. However, for polarized neutrons, \( (N + M)^{\beta} = 1.641 \) and \( (N - M)^{\beta} = 0.687 \) , giving a ratio of R = 2.39 and a readily observable effect. When the magnetic field is turned on, the intensity should increase from \( N^{\beta} + \frac{2}{3} M^{\beta} \) to \( (N + M)^{\beta} \) , i.e., by 40%.
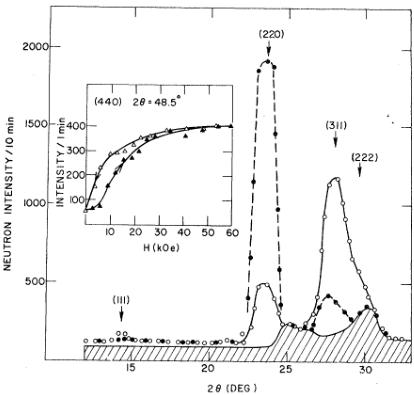
In Fig. 4, we illustrate the intensities obtained with and without the applied magnetic field. The most striking feature of these scans is the large changes that occur in the Bragg intensities. The intensity of the (220), for example, changes by a factor of 5 rather than the 40% we expect. Note also the decrease in the (111), (222), and (311) intensities. These changes are due to rotation of the individual crystallites within the polycrystalline sample, which is in the form of loosely packed powder. If \( \langle111\rangle \) is the easy direction of magnetization, we would expect these axes to lie parallel to the applied field and thus perpendicular to the scattering plane, which contains the incident beam and the detector. Under these conditions, the intensity of the (111), (222), and (311) reflections will be reduced. Conversely, the \( \langle110\rangle \) axes, six of which are perpendicular to the [111] axis, will lie in the scattering plane, and the (220), (440), etc. reflections will be enhanced. As shown in Fig. 4, this is qualitatively the effect observed when the field is applied. Although a quantitative calculation of the changes in intensity depends on a num-

FIG. 4. Scans taken with polarized neutrons on a polycrystalline sample of \( NpFe_{2} \) at 80 K. The shaded area is background and scattering from the cryostat. Open circles taken at H=0, closed circles at H=22 kOe. The insert illustrates the variation of the (440) reflection with applied magnetic field.

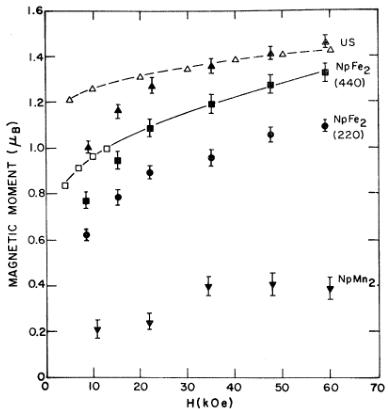
FIG. 5. Magnetic moments as a function of field for polycrystalline samples at 5 K. Closed symbols represent neutron-diffraction data and the open symbols were obtained from magnetization results. All neutron data points except the \( NpFe_{2} \) (440) refer to actinide moments only. For the (440) reflection, the quantity plotted is \( \mu_{Np}/N_{p} + 2\mu_{Fe}/f_{Fe} \) (see text).
ber of factors not readily obtainable in the present case, \( ^{13} \) the qualitative information obtained in these experiments is extremely useful and gives unambiguously the easy direction of magnetization. The finding of a \( \langle111\rangle \) easy direction in \( NpFe_{2} \) is in agreement with the hyperfine-field studies, \( ^{5,6} \) In experiments concerned with integrated intensities, preferred orientation (whether field or mechanically induced) complicates the determination of microscopic properties. Fortunately, this is not the case in polarized-neutron experiments because the flipping ratio R is independent of the integrated intensity. Of course, if the intensity is reduced to zero, the flipping ratio cannot be measured, and, with \( NpFe_{2} \) , we have been able to measure the flipping ratios of only four reflections.
The results deduced from measuring the flipping ratios of the (220) and (440) reflections as a function of field are illustrated in Fig. 5. The structure factor of the (220) reflections arises from neptunium atoms only, and the value of \( \mu_{Np} \) may be derived directly if a value for \( f_{Np} \) is known. For the (440) reflection, the scattering arises from both atoms and the quantity plotted is \( \mu_{Np}f_{Np} + 2\mu_{Fe}/f_{Fe} \) . Since the values derived from the (440) reflection are greater than those from the (220), the neptunium and iron moments are ferromagnetically aligned. In principle, the saturation magnetic moments of both atoms can be determined independently from the neutron results. However, the interpretation of these \( \mu \) -vs-H plots is not necessarily straightforward. The first difficulty arises from possible depolarization of the polarized neutrons as they pass through the sample. Neutrons initially polarized along the z axis, which is also the axis of the externally applied magnetic field, will be depolarized (i.e., have nonzero x and y components of the polarization vector) if they encounter nonzero \( H_{x} \) and \( H_{y} \) components of the resultant magnetic field. In an unsaturated polycrystalline ferromagnet, considerable depolarization will occur. Indeed, we have recently used this phenomenon to determine the Curie temperature of the actinide ferromagnet \( NpC.\^{9} \) Fortunately, the depolarization is minimized by using loosely packed samples, in which some of the particles can rotate to align with the applied field, and by working at high magnetic fields. Measurements as a function of field on loosely packed samples of actinide ferromagnets indicate that the depolarization decreases exponentially with the approach to saturation. For H>30 kOe, we expect the depolarization to be quite small. An additional difficulty arises in interpreting the neutron results because of the magnetically induced preferred orientation. Although this effect helps reduce depolarization, the sample is no longer randomly packed, and this may introduce errors in judging the approach to saturation.
To investigate these difficulties experimentally, we have performed high-field polarized-neutron experiments on a polycrystalline sample of US. The advantage in studying US is that magnetization and neutron experiments have been performed on both polycrystalline and single-crystal samples. The results deduced from measurements on the (220) reflection are shown in Fig. 5. The (220) reflection increases by a factor of 5 when a magnetic field is applied, indicating a \( \langle111\rangle \) easy axis of magnetization in US. To deduce the magnetic moment, we have used the form factor of the (220) reflection (=0.716) given by Wedgwood. \( ^{14} \) High-field magnetization experiments have been reported on both polycrystalline ingots \( ^{15} \) and single crystals. \( ^{16} \) Gardner and Smith \( ^{16} \) determined a saturation magnetic moment of \( 1.55\mu_{B}/(U \) atom) and a high-field susceptibility \( \chi_{M}=3.8\times10^{-3} \) emu/mole for a single-crystal sample. The easy direction of magnetization is \( \langle111\rangle \) , which is consistent with the rhombohedral distortion observed at \( T_{C} \) by Marples. \( ^{17} \) From polarized-neutron experiments on single crystals, Wedgwood \( ^{14} \) determined a magnetic moment of \( (1.70\pm0.03)\mu_{B}/(U \) atom). The discrepancy between the moments determined by magnetization and neutron experiments is not fully understood. However, by analogy with transition-metal and lanthanide ferromagnets (for example, Fe and Gd), we follow Wedgwood in assuming that this discrepancy arises from a conduction-
TABLE III. Results of polarized-neutron experiments at 5 K (unless otherwise noted) and with an applied field of 60 kOe. N/mole is the nuclear structure factor per molecule, \( \gamma = M/N \) is derived from the flipping ratio, and f and \( \mu \) indicate form factors and magnetic moments (in Bohr magnetons), respectively. The absence of a standard deviation for \( \mu_{Np} \) indicates the value has been assumed fixed in deriving \( \mu_{tm} \) .
| Compounds | hkl | N/mole | γ=M/N | fNp | fTm | μNp | μTm |
| NpFe2 | 220 | Np | 0.233(6) | 0.83 | ... | 1.10(3) | ... |
| 311 | Np/√2 + Fe | 0.22(3) | 0.77 | 0.65 | 1.10 | 1.2(2) | |
| 422 | Np | 0.163(11) | 0.60 | ... | 1.06(7) | ... | |
| 440 | Np + 2Fe | 0.122(5) | 0.53 | 0.33 | 1.10 | 1.1(2) | |
| NpCo2 | 220 | Np | 0.117(8) | 0.83 | ... | 0.55(4) | ... |
| 220 | Np | 0.034(15) | 0.83 | ... | 0.16(7) | ... (T=24 K) | |
| 440 | Np + 2Co | 0.045(3) | 0.53 | 0.35 | 0.55 | <0.15 | |
| NpMn2 | 111 | Np/√2 - Mn | 0.012(8) | 0.92 | 0.90 | 0.4 | 0.2(1) |
| 220 | Np | 0.085(10) | 0.83 | ... | 0.40(5) | ... |
electron polarization of \( 0.15\mu_{B} \) arranged antiparallel to the localized moment of \( 1.70\mu_{B} \) . (This assumption, although useful conceptually in interpreting the data, is almost certainly too simple. In gadolinium, the presence of a nonlocalized moment appears to be established experimentally, \( ^{18} \) but, in the transition series, theoretical evidence \( ^{19} \) suggests that such an interpretation of the neutron experiments \( ^{20} \) is incorrect.) Neutron experiments will see the localized moment only, but the magnetization experiments measure the total moment. Suski et al. \( ^{15} \) have measured the magnetization of polycrystalline ingots of US in fields up to 80 kOe. Their results, converted to magnetic moment in the usual manner and then increased by 1,70/1,55 = 1,097 to compare them with the neutron results, are plotted as the open triangles in Fig. 5. At high fields the agreement is remarkably good, indicating that neither preferred orientation nor depolarization significantly affect the neutron results. At fields lower than 25 kOe, the neutron values fall below those obtained from magnetization experiments, a consequence of depolarization. In conclusion, for magnetic fields greater than \( \sim30 \) kOe, a one-to-one correlation appears to exist between the magnetic moments obtained from neutron-diffraction and magnetization data in these highly anisotropic actinide systems.
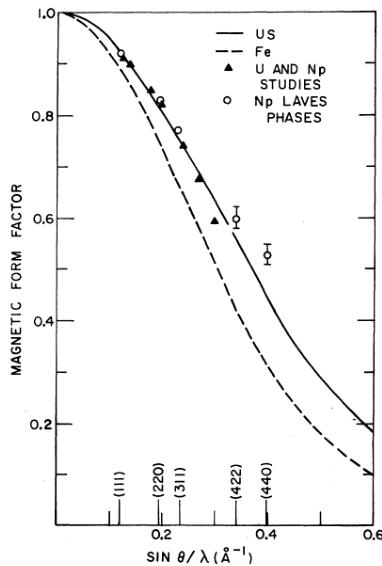
The values of the individual magnetic moments as determined by neutron diffraction in \( NpFe_{2} \) at H = 60 kOe are given in Table III. These determinations depend to a certain extent on the choice of a magnetic form factor, and in Fig. 6 we show some actinide form factors. \( ^{21} \) In an investigation of the magnetization density in \( UFe_{2} \) , Yessik \( ^{2} \) reported a much expanded form factor for uranium, but the moment on the uranium site was only \( (0.030 \pm 0.003)\mu_{B} \) , and we do not anticipate that such an anomalous form factor is typical of the Laves phases. The form-factor points determined in the present investigation are shown in Fig. 6. For the Fe site we have used the atomic-iron form factor, \( ^{20} \) and the two points from the (311) and (440) reflections agree well with this form factor.
In comparing the magnetic moments determined by both neutron-diffraction and magnetization measurements for \( NpFe_{2} \) , we are faced with the problem of a possible nonlocal moment, such as seems to be present in US and a number of other ferro-

FIG. 6. Magnetic form factors for some actinide materials and metallic iron.
magnets. We have taken the simplest approach and applied the normalizing factor from US to the present magnetization data for \( NpFe_{2} \) (this would imply a nonlocal moment of \( \sim0.3\mu_{B} \) ). To plot the magnetization data on Fig. 5, we assume that \( \mu_{Np} \approx \mu_{Fe} \) (an assumption borne out by the analysis of the neutron data), so that the magnetization values (Fig. 3) are converted to magnetic moment per atom in the usual manner, multiplied by \( f_{Np} + 2f_{Fe} \) (=1.19), and finally multiplied by the US normalization factor. These data are shown in Fig. 5 (open squares). In the overlapping (low-) field range, the magnetization values are considerably higher than the neutron values because of neutron depolarization. However, the magnetization data are entirely consistent with the high-field neutron results; the solid line in Fig. 5 through both sets of values represents a fit to be discussed later. It should be emphasized here that a normalization factor substantially different from the US value of 1.097, e.g., say 1.05 or 1.15, gives magnetization values that do not match with the high-field neutron data.
In view of the wide field range of the combined data, it is possible to consider quantitatively the approach-to-saturation behavior of \( NpFe_{2} \) . The approach to saturation of the magnetization \( \sigma \) of a polycrystalline sample is generally considered to be of the form \( ^{11} \)
\[ \sigma=\sigma_{\mathrm{s a t}}(1-a/H-b/H^{2})+\chi H, \quad (1) \]
where the saturation magnetization \( \sigma_{sat} \) is related to the average magnetic moment per mole at saturation \( \bar{\mu}_{sat} \) , a and b are constants that can be interpreted in terms of defects in the material and magnetocrystalline anisotropy, and \( \chi \) is a high-field susceptibility. The field dependence of the magnetization is large in actinide ferromagnets, but the approach to saturation is slower than implied by Eq. (1), i.e.,
\[ \sigma=\sigma_{\mathrm{s a t}}(1-C/H^{n})+\chi H, \quad (2) \]
where n is an exponent substantially less than unity.
In the case of US, a least-squares fit to the neutron data of Fig. 5, with \( n = \frac{1}{2} \) , yields a \( \bar{\mu}_{sat} \) value \( (1.67\mu_{B}/\mathrm{mole}) \) in reasonable agreement with that determined by Wedgwood \( ^{14} \) from a single-crystal sample \( (\bar{\mu}_{sat} = 1.70\mu_{B}/\mathrm{mole}) \) . The results of such an analysis are given in Table IV. For a \( \langle 111 \rangle \) easy axis of magnetization and infinite anisotropy, the maximum moment observed in a polycrystalline ferromagnet will be 86.7% of the fully aligned moment. \( ^{22} \) The entries in Table IV are close to this value, illustrating again the large anisotropy in these actinide ferromagnets. The susceptibility of US given in Table IV compares well with the value of \( 3.8 \times 10^{-3} \) emu/mole reported by Gardner and Smith. \( ^{16} \) Thus, a great deal of internal consistency exists in the magnetization and neutron-diffraction results for single-crystal and polycrystalline US. This gives us the confidence to proceed with a similar analysis for \( NpFe_{2} \) , while pointing out the advantages of using single crystals when available.
Unfortunately, we have no a priori means of determining the value of n for \( NpFe_{2} \) , except from the quality of the fit to the data, as indicated by the RMS error, and this error is not a sensitive function of n. We have, in fact, chosen a value of \( n = \frac{1}{3} \) similar to that for US, and the fit to the neu-
TABLE IV. Results of an approach-to-saturation analysis of magnetic-moment data for \( NpFe_{2} \) , \( NpNi_{2} \) , and \( NpMn_{2} \) at 5 K. The fitted equation was of the form \( \bar{\mu}=\bar{\mu}_{\mathrm{sat}}(1-C/H^{n})+\chi H \) . The induced moment at 60 kOe, \( \bar{\mu}_{ind} \) , was calculated from the susceptibility.
| Compound | Data region | n | \( \bar{\mu}_{\text{sat}} \) ( \( \mu_{B} \) /mole) | \( \chi_{M} \) (emu/mole) \( \times \) \( 10^{3} \) | % sat (60 kOe) | \( \bar{\mu} \) (60 kOe) ( \( \mu_{B} \) /mole) | \( \bar{\mu}_{\text{ind}} \) (60 kOe) ( \( \mu_{B} \) /mole) ( \( \mu_{B} \) /mole) |
| US | a | \( \frac{1}{2} \) | 1.67(2) | 5(1) | 85 | 1.47 | 0.05 |
| NpFe \( _{2} \) | b | \( \frac{1}{3} \) | 3.06(6) | 69(4) | 85 | 3.38 | 0.74 |
| c | \( \frac{1}{3} \) | 3.11(3) | 51(5) | 87 | 3.23 | 0.49 | |
| NpNi \( _{2} \) | c | \( \frac{1}{3} \) | 0.96(2) | 21(3) | 87 | 1.06 | 0.22 |
| c | \( \frac{1}{5} \) | 1.19(3) | 14(2) | 76 | 1.02 | 0.15 | |
| NpMn \( _{2} \) | c | \( \frac{1}{3} \) | 0.37(1) | 26(1) | 88 | 0.60 | 0.28 |
| c | \( \frac{1}{5} \) | 0.45(1) | 23(1) | 75 | 0.59 | 0.25 | |
\( ^{a} \) Data include four neutron points between 22 and 60 kOe.
\( ^{b} \) Data include four magnetization points between 3 and 13 kOe and four neutron points between 22 and 60 kOe.
\( ^{c} \) Data include 11 magnetization points between 3 and 13 kOe. All magnetization data were multiplied by a factor 1.097 obtained from an analysis of the results for US (see text). The percentage-saturation value and magnetic moment at 60 kOe are obtained by extrapolation.
tron and magnetization data for \( NpFe_{2} \) is shown as the solid line in Fig. 5; the rms errors are, again, smaller than the experimental uncertainties. The parameters obtained are given in Table IV. The most striking feature of this analysis is the large susceptibility—a factor of 10 larger than the value for US. The \( \mu_{N_{p}} \) values [obtained from the (220) reflection] plotted in Fig. 5 show the same field dependence as the total moment per mole \( \overline{\mu} \) [obtained from the (440) reflection]. The information provided by these analyses of the two reflections (Fig. 5) allows a determination to be made of the spontaneous moment on each site. Analysis of the magnetization data alone (Fig. 3) leads to the second set of parameters in Table IV. The good agreement, particularly between the respective \( \overline{\mu}_{sat} \) values, lends confidence to extrapolation procedures based only on magnetization data. The final values of the spontaneous magnetic moments on the neptunium and iron sites are \( (1.0\pm0.1)\mu_{B} \) and \( (1.05\pm0.1)\mu_{B} \) , respectively. From the hyperfine-field-splitting data of Table II, we deduce a magnetic moment of \( 0.87\mu_{B} \) on the neptunium site. However, this result should be viewed with caution since the deduction from the NGR experiments depends on an assumption that the hyperfine field is due to only the neptunium moment. In this case, the iron atom also carries a large moment, and the possibility of a transferred hyperfine field must be considered. For example, in \( YFe_{2} \) a spin-echo measurement has shown a rather large hyperfine field of -220 kOe at the yttrium site. \( ^{23} \)
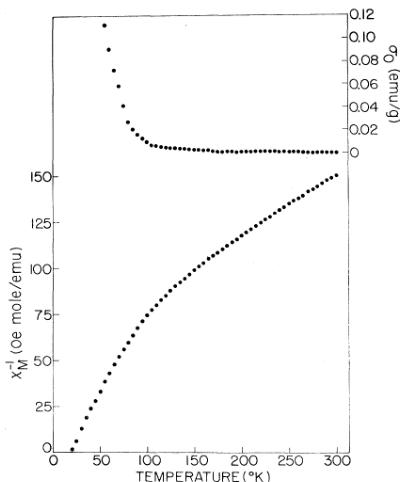
B. NpNi_{2}
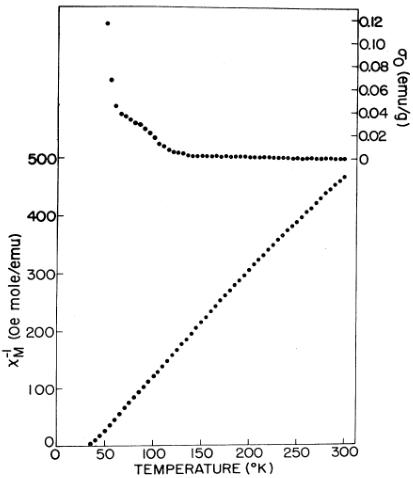
The magnetization-vs-field curves for \( NpNi_{2} \) are linear from 2, 5 to 13, 5 kOe over the range 75–300 K, and the susceptibility increases with a decrease in temperature. Extrapolation of \( \sigma \) to \( H_{i}=0 \) ( \( H_{i} \) is the internal field) gives a zero intercept ( \( \sigma_{0}=0 \) ) between 140 and 300 K; below 140 K, \( \sigma_{0} \) becomes positive and increases with a decrease in temperature. Such behavior, characteristic of a ferromagnetic component of the total magnetization, is typical of neptunium Laves phases, \( ^{8} \) The reciprocal molar susceptibility as a function of temperature and the temperature dependence of \( \sigma_{0} \) is shown in Fig. 7. The \( \chi_{1}^{0} \) -vs-T plot shows a smooth curvature between 300 and \( \sim65 \) K. Below \( \sim140 \) K, an upturn in \( \sigma_{0} \) occurs, with a more rapid increase when the temperature reaches \( \sim65 \) K. Thus the value of \( \sigma_{0} \) seems to be strongly coupled to the magnitude of the bulk susceptibility of the sample. The \( \sigma \) -vs- \( H_{i} \) plots below 75 K become curved and were analyzed in terms of the modified Arrott-plot equation
\[ H_{i}/(\sigma-\sigma_{0})=A(\sigma-\sigma_{0})^{2}+B, \quad (3) \]
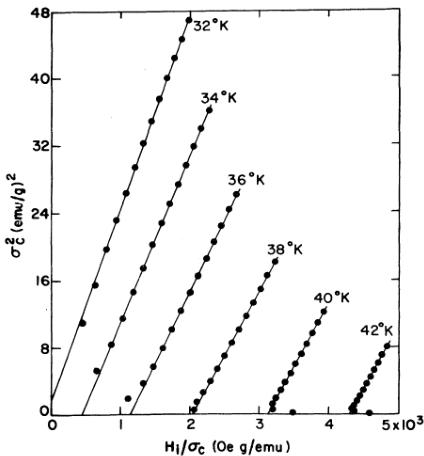
where \(\sigma_{0}\), \(A\), and \(B\) are adjustable parameters,\(^{8}\) Some plots of \(\sigma_{c}^{2}\) vs \(H_{i}/\sigma_{c}\), where \(\sigma_{c}=\sigma-\sigma_{0}\), near the transition temperature are shown in Fig. 8. The use of Eq. (3) to represent the data seems appropriate, and, on the basis of the temperature dependence of \(B\) (\(\approx\chi_{0}^{1}\)) and the curves in Fig. 8, we estimate a Curie temperature of \(T_{C}=32\pm1\) K for NpNi\(_{2}\). The uncertainty arises primarily from the rapid increase in \(\sigma_{0}\) as \(T_{C}\) is approached; a maximum value of \(\sigma_{0}=0.392\) emu/g at 32 K is obtained.
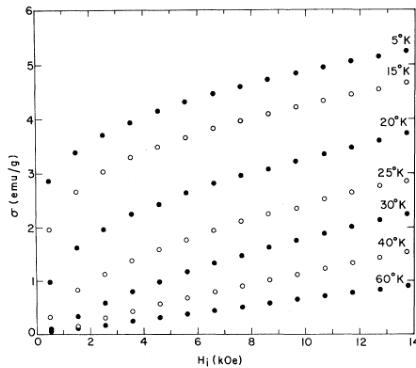
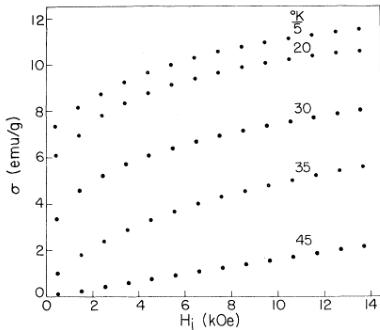
Low-temperature magnetization curves for \( NpNi_{2} \) are shown in Fig. 9. The pronounced field dependence at 5 K, similar to that of \( NpFe_{2} \) , is typical of these compounds \( ^{8} \) and may again be associated in part with magnetocrystalline anisotropy. The increase in magnetization between 3, 5 and 13.5 kOe at 5 K is almost identical to that in \( NpFe_{2} \) ( \( \sim25\% \) ); the maximum magnetization corresponds to a moment of \( 0.73\mu_{B}/mole \) .
The results of the neutron experiments at 80 K are summarized in Sec. II. At helium temperature, no new peaks were observed in the diffraction pattern, but increases were observed in the low-angle nuclear peaks. After correcting for absorption and thermal effects, the 80-K data were subtracted from the intensities taken at 5 K to obtain the magnetic scattering at 5 K. The magnetic intensities are consistent with a ferromagnetic structure in which \( \mu_{N_{p}}=(1.20\pm0.15)\mu_{B} \) and \( \mu_{N_{1}}\leqslant0.3\mu_{B} \) . The value at the neptunium atom is in good agreement with the estimate of \( 1.2\mu_{B} \) based on the magnetic hyperfine field (Table II). We have not determined the ordering temperature, the field dependence of

FIG. 7. Temperature dependence of the reciprocal molar susceptibility and \(\sigma_{0}\) (see text) for NpNi\(_{2}\).

FIG. 8. Arrott plots for \( NpNi_{2} \) at the temperatures indicated.
the magnetic moment, or the easy direction of the magnetization in \( NpNi_{2} \) by means of neutron experiments. A limited number of NGR spectra indicate a transition temperature of \( \sim29 \) K. Gal et al. \( ^{8} \) used NGR techniques to determine a Curie temperature of \( 28\pm2 \) K for their sample of \( NpNi_{2} \) .
In view of the apparently successful application of the approach-to-saturation expression [Eq. (2)] to \( NpFe_{2} \) , we have performed a similar analysis of the magnetization data for \( NpNi_{2} \) , although no high-field neutron data are available. The data for \( NpNi_{2} \) at 5 K (Fig. 9) from 3, 5 to 13.5 kOe were fitted to Eq. (2) with the same value of \( n=\frac{1}{3} \) used for \( NpFe_{2} \) . The parameters obtained are given in Table IV, and the rms error was \( \sim0.1\% \) of \( \sigma(13.5\ \mathrm{kOe}) \) . The value of \( \overline{\mu}_{sat} \) is again lower (by \( \sim0.3\mu_{B}/mole \) ) than that given by the zero-field neutron-diffraction experiments, and this difference suggests that a substantial nonlocal moment also occurs in \( NpNi_{2} \) . The ratio of \( \chi_{M}(NpNi_{2}) \) to \( \chi_{M}(NpFe_{2}) \) is \( \sim0.3 \) , and this is consistent with the ratio \( \overline{\mu}(NpNi_{2})/\overline{\mu}(NpFe_{2}) \) , which is also \( \sim0.3 \) . If n is decreased to \( \frac{1}{2} \) , a least-squares fit to Eq. (2) gives the second set of values for \( NpNi_{2} \) in Table IV, with a slightly smaller rms error. In this case, the nonlocal moment would be \( \sim0.1\mu_{B}/mole \) , i.e., \( \sim10\% \) of the total moment \( \overline{\mu} \) .
C. NpMn_{2}
The magnetization-vs-field curves for \( NpMn_{2} \) are linear from 2.5 to 13.5 kOe in the temperature range 100–300 K. Below 100 K, the plots are curved, and they were treated in terms of Eq. (3) to correct for the effect of \( \sigma_{0} \) and to determine \( \chi_{0}^{1} \) . The reciprocal molar susceptibility is plotted against temperature in Fig. 10. The data are quite sharply curved over the range from 50 to 300 K. The change in sign of the curvature below 50 K is similar to that observed in \( NpNi_{2} \) and is presumably associated with the critical phenomena present just above \( T_{C} \) . The value of \( \sigma_{0} \) is essentially zero between 300 and 175 K and increases below this temperature, with a more rapid decrease below 100 K. The maximum value of \( \sigma_{0} \) attained near \( T_{C} \) is 0.35 emu/g.
A number of isotherms for \( NpMn_{2} \) between 5 and 60 K are shown in Fig. 11. The data above 20 K have been corrected by subtracting a value of \( \sigma_{0} \) determined in the fit to Eq. (3) mentioned above. The Arrott plots based on this fit do not show as good a linear \( \sigma_{e}^{2} \) -vs- \( H_{1}/\sigma_{c} \) relationship as observed in \( NpNi_{2} \) . Because of the wide temperature region over which the \( \sigma \) -vs- \( H_{i} \) plots are curved, we are less confident of the bulk ferromagnetic transition temperature of this compound. An additional difficulty is the relatively slow decrease of \( \chi_{0}^{1} \) with a decrease in temperature just above \( T_{C} \) . On the basis of the magnetization data, we estimate that \( T_{C} \approx 18 \) K. This compound is the most difficult of the neptunium Laves phases to prepare (Sec. II), and, despite the heat treatment, the sample may not be homogeneous (the stoichiometry range is not known).
The room-temperature neutron studies of \( NpMn_{2} \) are discussed in Sec. II. Initially, only a small amount of \( NpMn_{2} \) was available for neutron studies, and the depolarization of polarized neutrons through a 1-g sample was studied at 5, 80, and 300 K. The essential point of this technique \( ^{9} \) is that depolariza-

FIG. 9. Typical magnetization-vs-internal-field plots for \( NpNi_{2} \) between 5 and 45 K.

FIG. 10. Temperature dependence of the reciprocal molar susceptibility and \( \sigma_{0} \) (see text) for \( NpMn_{2} \)
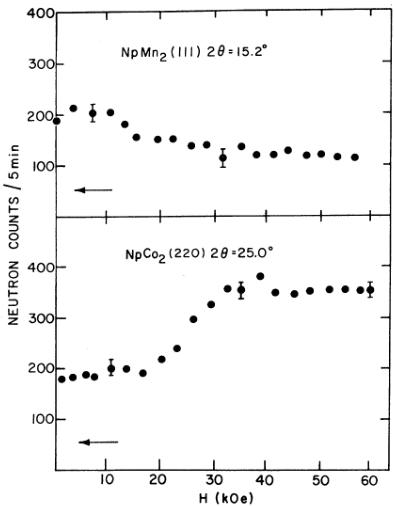
tion occurs only for ferro- or ferrimagnetic materials. The experiments on \( NpMn_{2} \) with an applied field of 9 kOe showed a depolarization of \( (3.5\pm0.5)\% \) at 5 K. This low value suggests a small saturation moment, and implies that the sample is ferromagnetic at helium temperature. Later, a larger sample of 2.41 g was made, and conventional polarized-beam experiments were performed. The variation of the (111) intensity as a function of applied field at 5 K is shown in Fig. 12. The decrease in the (111) intensity, together with the other changes observed, implies a (111) easy magnetization direction in \( NpMn_{2} \) (as in \( NpFe_{2} \) , see Fig. 4), but the degree of anisotropy is less than in either \( NpFe_{2} \) or \( NpCo_{2} \) . Measurements on the (220) reflection as a function of field indicated saturation above 40 kOe with \( \mu_{Np}=(0.40\pm0.05)\mu_{B} \) (Fig. 5). A measurement of the (111) flipping ratio (Table III) indicates that a magnetic moment is also present on the Mn site. At 60 kOe, \( \mu_{Mn}=(0.2\pm0.1)\mu_{B} \) and is parallel to the netpium moment.
The field dependence of the magnetization at 5 K (Fig. 11) is similar to the other neptunium Laves-phase compounds. The change in magnetization between 3.5 and 13.5 kOe ( \( \sim35\% \) ) is somewhat greater than in the remaining compounds; the maximum moment attained is \( 0.33\mu_{B}/mole \) at 13.5 kOe. An approach-to-saturation analysis of the magnetization and neutron data for \( NpMn_{2} \) suffers from the same problem as \( NpFe_{2} \) ; i.e., what is the correct value of n? Also, the large relative errors on the moments determined by the neutron experiments make a fit to the combined results over a wide field range, as in the case of \( NpFe_{2} \) , impractical. A least-squares analysis of the magnetization data from 3.5 to 13.5 kOe at 5 K (Fig. 11) with \( n=\frac{1}{3} \) yields the values given in Table IV; the rms error is small [ \( \sim0.04\% \) of \( \sigma(13.5\ \mathrm{kOe}) \) ]. If \( n=\frac{1}{5} \) , a value found to give good results for \( NpNi_{2} \) , then the least-squares fit gives the second set of values for \( NpMn_{2} \) in Table IV and a smaller rms error than the fit with \( n=\frac{1}{3} \) . Extrapolation of these fits to 60 kOe, the maximum field employed in the neutron-diffraction experiments, would give moments of \( \bar{\mu}=0.55\mu_{B}/mole \) ( \( n=\frac{1}{3} \) ) or \( 0.54\mu_{B}/mole \) ( \( n=\frac{1}{5} \) ), which may be compared with a total neutron-diffraction moment ( \( =\mu_{Np}+2\mu_{Mn} \) ) of \( (0.8\pm0.2)\mu_{B}/mole \) . This discrepancy may again be associated with a nonlocal moment.
The uncertainty surrounding the value of \( \chi_{M} \) clearly makes it difficult to obtain any reliable estimate for the spontaneous magnetic moment in \( NpMn_{2} \) from either the magnetization or neutron data. We estimate the moment on the neptunium atom is \( (0.3\pm0.1)\mu_{B} \) in zero field and suggest that the magnetic moment of \( \sim0.2\mu_{B} \) at the manganese site may not be spontaneous but a response to the magnetic field. This interpretation is supported by the zero-field NGR results, where the magnetic hyperfine field provides an estimate of \( \mu_{Np}\simeq0.2\mu_{B} \) . In all, the magnetic character of \( NpMn_{2} \) is the least well defined of any of the compounds studied here.
D. \( NpCo_{2} \)
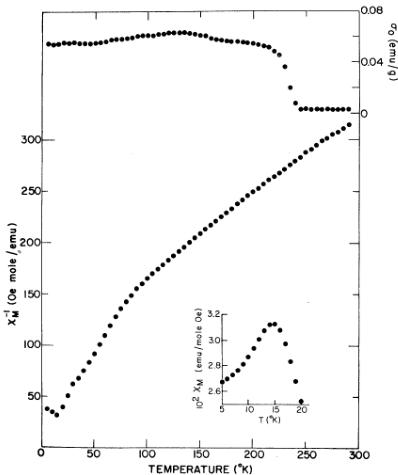
The \( \sigma \) -vs- \( H_{1} \) plots for \( NpCo_{2} \) are linear from 1.5 to 13.5 kOe over the entire temperature range. Values of the reciprocal molar susceptibility and \( \sigma_{0} \) are shown as a function of temperature in Fig.

FIG. 11. Magnetization-vs-internal-field curves for \( NpMn_{2} \) between 5 and 60 K.

FIG. 12. Field dependence of the intensity of the (111) reflection from \( NpMn_{2} \) (top) and the (220) reflection from \( NpCo_{2} \) (bottom), both at 5 K. The horizontal arrows indicate the background level.
- The rapid increase in \( \sigma_{0} \) below 250 K has, in the case of \( NpCo_{2} \) , a clear-cut origin. As noted in Sec. II, this sample was made from a batch of relatively impure neptunium that contained a small amount of carbon. NpC becomes ferromagnetic at 225 K, and its magnetization is consistent with the values of \( \sigma_{0} \) shown in Fig. 13 and the carbon concentration. The \( \chi_{\perp}^{M} \) -vs-T plot (Fig. 13) has a shallow curvature between 300 and 90 K. A sharp increase in slope occurs below 90 K, and the susceptibility maximum at \( 15\pm1 \) K (inset of Fig. 13) indicates antiferromagnetic ordering. The temperature dependence of the NGR linewidth gives the same transition temperature.
As indicated in Sec. II, the scattering length obtained at the cobalt site in neutron-diffraction experiments on \( NpCo_{2} \) is in serious disagreement with published values (Table I). Compositional problems with cobalt compounds in the Laves-phase structures occur relatively frequently, usually manifested in a cobalt deficiency. Therefore we might expect the true formula to be \( NpCo_{2-x} \) , with \( 0 < x \leq 0.1 \) . This would result in a value of \( b_{co} \) smaller than the accepted value, whereas the experimental value of \( b_{co} \) is too large. The alternative solution of a neptunium deficiency is certainly possible, but, to satisfy the experimental data, the composition must be \( Np_{0.8}Co_{2} \) , which seems too far from stoichiometry to be accepted. Yet another possibility is that some interchange of the neptunium and cobalt atoms occurs, and, for this case, the data are consistent with a 5% interchange of atoms. Again, this solution appears unlikely in view of the large size difference between the Np and Co atoms and the high density of packing associated with the Laves-phase structure. To investigate whether the actinide-cobalt Laves phases are, in general, nonstoichiometric, a sample of \( UCo_{2} \) was prepared and examined. The result of the least-squares analysis was \( b_{Co} = 0.260(9) \) , which is in agreement with the published value \( ^{10} \) of \( b_{Co} = 0.250 \) , and R = 0.029. The refinement on \( UCo_{2} \) shows that the compositional problems are confined to \( NpCo_{2} \) and are not a general property of actinide cobalt compounds. We are therefore left without an adequate understanding of the compositional problems that exist in \( NpCo_{2} \) .
These difficulties probably are also manifested in the NGR spectra for this compound. Although the magnetic splitting in Fig. 2 is relatively large for \( NpCo_{2} \) , the spectrum shows severe line broadening well below the transition temperature. These effects have been discussed by Gal et al. \( ^{7} \) in terms of magnetic relaxation and a distribution of hyperfine fields. The compositional problem revealed by the neutron experiments would enhance the latter mechanism. Therefore detailed discussions

FIG. 13. Temperature dependence of the reciprocal molar susceptibility and \( \sigma_{0} \) (see text) for \( NpCo_{2} \) . The inset shows the maximum in the susceptibility near 15 K on an expanded scale.
of possible relaxation effects should await a solution of the metallurgical problems. In addition, Gal et al. \( ^{7} \) gave a transition temperature of \( 8.4 \pm 0.2 \) K, and our result is \( 15 \pm 1 \) K, a discrepancy we also attribute to the difficulty encountered in obtaining a well-characterized stoichiometric sample of \( NpCo_{2} \) .
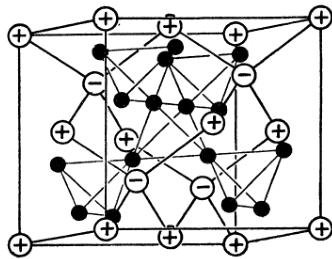
At 5 K, careful neutron-diffraction scans were taken between 5° and 20° 2θ, i.e., from before the ( \( \frac{1}{200} \) ) to after the (200) reflection positions. In this range, no Bragg peaks except the (111) nuclear were observed (Fig. 1). The intensities of the (111) reflections at 5 and 80 K were the same to within ±4%. The magnetization results given earlier indicate that \( NpCo_{2} \) is antiferromagnetic, and the hyperfine field of 900 kOe suggests a magnetic moment of \( \sim0.5\mu_{B}/(Np\ atom) \) . The magnetic cross section from \( 0.5\mu_{B}/(Np\ atom) \) is small and might be difficult to detect. For a ferromagnet with this magnetic moment, the increase at the (111) reflection would amount to only 2.8%. However, for antiferromagnetic structures, the magnetic symmetry is often lower than the crystal symmetry, and this gives rise to additional Bragg peaks. With polycrystalline samples, the intensities of low-angle reflections are greatly enhanced by the Lorentz factor, which is proportional to \( (\sin\theta\sin2\theta)^{-1} \) , where \( 2\theta \) is the Bragg angle. Thus, even with \( 0.5\mu_{B}/(Np\ atom) \) , we might expect to see antiferromagnetic peaks if the magnetic unit cell is larger than the chemical unit cell. Polarized-neutron experiments on \( NpCo_{2} \) will be unable to detect the magnetic scattering in the antiferromagnetic state, because no coherence exists between the nuclear and magnetic scattering amplitudes. However, Fig. 12 shows that the antiferromagnetic coupling in \( NpCo_{2} \) is destroyed by an applied magnetic field of 30 kOe, resulting in an induced ferromagnetic (metamagnetic) state. The easy direction of magnetization in the metamagnetic state is \( \langle111\rangle \) , as in \( NpFe_{2} \) . Measurements at 60 kOe on the (220) and (440) reflections (Table III) give \( \mu_{Np}=(0.55\pm0.05)\mu_{B} \) and \( \mu_{Co}\leq0.15\mu_{B} \) . As a check on the consistency of the polarized-beam technique, the flipping ratio R was measured at 24 K, i.e., above the Néel temperature \( T_{N} \) , and gave a magnetic moment of \( \mu_{Np}=(0.16\pm0.07)\mu_{B} \) . This moment corresponds to \( 1/\chi_{M}=60 \) mole/emu, in good agreement with the value of 50 mole/emu obtained in magnetization experiments (Fig. 13). The polarized-beam experiments strongly suggest a field-induced transition in \( NpCo_{2} \) ; compare, for example, the different intensity-vs-field data in Figs. 12 and 4. However, the question remains as to why no magnetic scattering is observed in the zero-field unpolarized-beam experiment. On the basis of our previous discussion, we suggest that the antiferromagnetic structure is simple and gives rise to no extra low-angle Bragg reflections. The simplest magnetic structure is one in which each neptunium atom is surrounded by four nearest-neighbor Np atoms with oppositely directed magnetic moments. The proposed antiferromagnetic structure is illustrated in Fig. 14. Along each cube axis, the structure may be viewed as sheets of ferromagnetic moments stacked in the simple +- sequence. The structure has cubic symmetry, implying that the square of the magnetic interaction vector is \( \frac{2}{3} \) for all reflections, and the magnetic and chemical unit cells are identical. With \( 0.5\mu_{B}/(Np\ atom) \) , this magnetic configuration gives rise to a 3% increase at the (111) nuclear reflection and a similar increase at the (200) reflection, which has a nuclear structure factor of 0. Both increases are on the borderline of experimental observation because of the small amount of \( NpCo_{2} \) available.
IV. DISCUSSION
The magnetic properties of the present neptunium compounds are summarized in Table V. For \( NpFe_{2} \) , the high-field susceptibility term is reasonably well determined and the spontaneous magnetic moments for each atomic site can be extracted from the results of high-field neutron experiments. For \( NpNi_{2} \) , the spontaneous magnetic moment has been determined directly by neutron diffraction. However, for \( NpMn_{2} \) and \( NpCo_{2} \) the high-field susceptibility (Table IV) is not known accurately, and the values of the spontaneous magnetic moments are rather uncertain. The magnetic moments in both \( NpMn_{2} \) and \( NpCo_{2}~ \) are small and undetectable with conventional unpolarized-neutron experiments with polycrystalline samples. The moments in Table V are based on the results of high-field polarized-neutron experiments (Table

FIG. 14. Laves-phase structure of the present neptunium compounds. The open circles represent actinide atoms, the closed circles the transition-metal atom. The proposed antiferromagnetic structure of \( NpCo_{2} \) is designated by + and - signs at the Np site. The spin direction is undetermined.
TABLE V. Magnetic properties of neptunium Laves phases. \(\mu_{\mathrm{Np}}\) and \(\mu_{\mathrm{tm}}\) represent the spontaneous magnetic moment on the neptunium and transition-metal atom, respectively.
| Parameters | NpFe2 | NpNi2 | NpMn2 | NpCO2 |
| a0(Å) | 7.144 | 7.098 | 7.230 | 7.045 |
| Magnetisma | F | F | F | AF |
| Ordering temperature (℃) | ~500 | 32(1) | 18(2) | 15(1) |
| μNp(μB) | 1.0(1) | 1.20(15) | ~0.3 | 0.5(1) |
| μtm(μB) | 1.05(10) | <0.3 | ~0.2 | <0.15 |
| Easy axis | (111) | ... | (111) | (111)b |
\( ^{a} \) F represents ferromagnetism, AF antiferromagnetism.
\( ^{b} \) In the metamagnetic state.
III) from which a small moment, which is assumed to arise from the susceptibility term, has been subtracted.
In the absence of any theory dealing specifically with the magnetism of actinide compounds, a useful starting point for our discussion is the extensive literature on rare-earth (lanthanide) Laves phases, \( ^{24} \) As we shall see, a number of similarities as well as some important differences exist between the lanthanide and actinide compounds. The most notable property of the present neptunium compounds is that the Curie temperature of \( NpFe_{2} \) is \( \lesssim 500 \) K, whereas the ordering temperatures of the other compounds are less than 40 K. This trend is similar to that in the rare-earth compounds, and we assume that the high ordering temperature is a reflection of the strong d-d exchange. Research on the lanthanide Laves phases has shown that the 3d moment is coupled antiparallel with the lanthanide spin S. This results in ferromagnetic behavior for the light rare-earth Laves phases, in which J=L-S, and ferrimagnetic behavior for compounds with the heavy rare earths, in which J=L+S. Although the use of Russell-Saunders coupling in the actinides should be treated with caution, our data on the neptunium series, in which the transition-metal moments are spontaneous (as in \( NpFe_{2} \) ) or induced (as in \( NpMn_{2} \) ), shows the anticipated ferromagnetic behavior.
Strong supporting evidence for an interpretation in terms of localized 5f electrons is deduced from a consideration of the magnetic anisotropy as well as from a plot of \( \mu_{Np} \) as obtained from neutron diffraction versus the magnetic hyperfine field \( H_{hf} \) . Figure 15 shows a good linear relationship between these two quantities. Because of experimental uncertainties in both the neutron and NGR experiments on \( NpMn_{2} \) , the point for this compound is not included in Fig. 15, although the linear relationship apparently also holds. The solid line is that obtained in our earlier study of the neptunium monopnictides, \( ^{25} \) By analogy with the rare-earth Laves phases, \( ^{24} \) we should expect the iron compound to lie on the right of this straight line. This is because any hyperfine field transferred from the iron site will oppose the central field at the neptunium site. Although the error bars are quite large in Fig. 15, the hyperfine field at the neptunium site in \( NpFe_{2} \) does appear suppressed. However, the linearity is still striking and is the type of behavior associated with lanthanide systems.
The magnetic anisotropy of the rare-earth Laves phases is one of their most interesting properties \( ^{26} \) and is attributed to the orbital moment on the rare-earth site. A systematic study by Bowden et al. \( ^{27} \) has shown that in the iron compounds the easy direction of magnetization follows the predictions of crystal-field theory. Similar considerations have been successful in explaining the easy directions observed in \( RAl_{2} \) (R = rare earth) compounds, \( ^{28,29} \) In the neptunium compounds, the anisotropy as observed by both magnetization and neutron experiments is also large. A calculation of \( K_{1} \) , the principal anisotropy constant, should be possible from the magnetization data, provided the saturation

FIG. 15. Relationship between the neptunium magnetic hyperfine field (obtained from NGR experiments) and the spontaneous magnetic moment (obtained by neutron diffraction) for the neptunium atom in the Laves-phase compounds. The straight line is that obtained in an earlier study of NaCl-type neptunium compounds (Ref. 25).
behavior extrapolates as \( 1/H^{2} \) , i.e., n=2 in Eq. (1). Unfortunately, as Table IV shows, this is not the case, and no reliable estimate of \( K_{1} \) is possible. Experiments on single crystals of \( {}^{16} \) O \( ^{18} \) have indicated a large anisotropy, and, judging by the percentage saturation (Table IV) and the extent of the magnetically induced preferred orientation observed in the neutron experiments, the anisotropy fields in US and \( NpFe_{2} \) are comparable. Both compounds have \( \langle111\rangle \) as the easy axis of magnetization, as do the other neptunium Laves-phases compounds examined here. Gal et al. \( ^{6} \) have shown that the easy axis is \( \langle111\rangle \) in \( UFe_{2} \) and \( NpFe_{2} \) and \( \langle100\rangle \) in \( PuFe_{2} \) . Blow, \( ^{6} \) however, claims that \( \langle111\rangle \) is probably the easy axis for the three compounds. The question of the extent and origin of the anisotropy in the actinide compounds will certainly not be answered until the results of experiments on single crystals are available. However, attempts to understand the easy directions in terms of simple crystal-field theory may be an incorrect approach, as we have already shown in a study of the lattice distortions in actinide compounds. \( ^{9} \)
An important difference between the rare-earth and actinide Laves-phase compounds is the presence of a varying magnetic moment at the neptunium site (Table V). In rare-earth systems, the magnetic moments of the rare-earth ions depend on the extent of the perturbation of the crystal-field ground state by the exchange field. \( ^{24} \) For rare-earth iron compounds, the exchange field is of sufficient strength to mix the excited crystal-field states into the ground state, so that the moment at the rare-earth site approaches the free-ion value. However, in the neptunium Laves phases, the magnetic moments are lower than found in other neptunium compounds \( ^{25} \) and cannot be understood with either a localized or itinerant-electron model. The neptunium moment is largest in \( NpNi_{2} \) , in which \( T_{C}=32 \) K and \( \mu_{Ni}<0.3\mu_{B} \) , and this is certainly unexpected on the basis of crystal-field theory. We regard these observations as evidence for d-f overlap in the Laves phases and the importance of band behavior. We have also reported the magnetic properties of neptunium Laves phases in which the alloying atoms are nonmagnetic. \( ^{8} \) For compounds with a Np-Np distance less than 3.25 Å, the 5f-electron wave functions appear to overlap and form a band. The bandwidth further increases because of hybridization with the s, p, and d electrons. In the present compounds, all Np-Np distances are less than 3.2 Å, and we would expect strong hybridization with both the conduction electrons and the 3d electrons. However, a model involving itinerant ferromagnetism is found to be inappropriate for these materials. Murata and Doniach \( ^{30} \) have suggested that a good criterion for itinerant ferromagnetism is that the quantity \( R=2\chi T_{C}/C \) is less than unity, where \( \chi \) is the high-field susceptibility at 0 K, \( T_{C} \) is the Curie temperature, and C is the Curie-Weiss constant immediately above \( T_{C} \) . Although \( NpOs_{2} \) fulfills this condition ( \( R=0.6 \) ), \( ^{8} \) neither \( NpNi_{2} \) ( \( R=1.4 \) ) nor \( NpMn_{2} \) ( \( R=1.1 \) ) satisfies this criterion of an itinerant system.
An interesting feature of the values in Table IV is the susceptibility deduced for the various compounds in the magnetically ordered state. We should immediately point out the difficulty in interpreting the magnetization results in the ordered state (whether derived from magnetization experiments directly or from the high-field neutron experiments) from polycrystalline samples that exhibit large anisotropy. The problem is compounded when the only high-field (H>13 kOe) data are from neutron experiments, and little experimental evidence is available to judge the reliability of this technique. Nevertheless, the results for US (Fig. 5 and Table IV), in which \( \chi_{M} \) is consistent with that obtained in single-crystal studies, \( ^{16} \) gives us confidence that the values in Table III do not arise from the interpretation of experimental data. These values are, however, quite large in comparison with cther metallic systems (for palladium \( \chi_{M}=0.7\times10^{-3} \) , and for iron \( \chi_{M}=0.3\times10^{-3} \) emu/mole at 4.2 K) and would also appear to argue in favor of band magnetism. Note that since the field dependence of the (220) and (440) reflections in \( NpFe_{2} \) (Fig. 4) are approximately the same, the high-field susceptibility in the ordered state is associated with both the neptunium and iron sites. Further experiments with NGR, magnetization, and neutron techniques in applied fields of up to 45 kOe are planned on both “localized” actinide ferromagnets (e.g., \( NpAl_{2} \) ) and the present materials.
In summary, the properties of the neptunium Laves phases discussed here present an excellent example of the localized-itinerant duality that is a recurring theme in investigations of actinide intermetallic compounds. At present, no obvious theoretical framework exists for discussing such diverse properties as the high-field susceptibility in the ordered state and the itinerant ferromagnetism of \( {}^{8} \) NpOs \( _{2} \) while taking into account the large orbital anisotropy and simple relationship between \( \mu_{Np} \) and \( H_{ht} \) (Fig. 15).
ACKNOWLEDGMENTS
We wish to thank A. W. Mitchell and J. F. Reddy for their excellent efforts in sample preparation and encapsulation. We would like to thank F. Y. Fradin and A. E. Dwight for a number of useful discussions, and R. L. Hitterman for his assistance with the neutron experiments at the CP-5 Research Reactor.
\( ^{\dagger} \) Work performed under the auspices of the U. S. Atomic Energy Commission.
\( ^{*} \) Present address: Hebrew University, Jerusalem, Israel.
\( ^{1} \) H. Hill, in Plutonium 1970 and Other Actinides, edited by W. N. Miner (AIME, New York, 1971), p: 2.
\( ^{2} \) M. Yessik, J. Appl. Phys. 40, 1133 (1969).
\( ^{3} \) S. T. Lin and A. R. Kaufman, Phys. Rev. 108, 1171 (1957).
\( ^{4} \) A. R. Harvey, M. B. Brodsky, and W. J. Nellis, Phys. Rev. B 7, 4137 (1973).
\( ^{5} \) S. Blow, J. Phys. C 3, 835 (1970).
\( ^{6} \) J. Gal, Z. Hadari, E. R. Bauminger, I. Nowik, S. Ofer, and M. Perkal, Phys. Lett. A 31, 511 (1970).
\( ^{7} \) J. Gal, Z. Hadari, U. Atzmony, E. R. Bauminger, I. Nowik, and S. Ofer, Phys. Rev. B 8, 1901 (1973).
\( ^{8} \) A. T. Aldred, B. D. Dunlap, D. J. Lam, and I. Nowik, Phys. Rev. B 10, 1011 (1974).
\( ^{9} \) G. H. Lander and M. H. Mueller, Phys. Rev. B 10, 1994 (1974).
\( ^{10} \) Neutron Diffraction Commission, Acta Crystallogr. A 28, 357 (1972).
\( ^{11} \) See, for example, R. M. Bozorth, Ferromagnetism (Van Nostrand, New York, 1951), pp. 484 et seq.
\( ^{12} \) R. Nathans and S. J. Pickart, in Magnetism, edited by G. T. Rado and H. Suhl (Academic, New York, 1963), Vol. III, p. 211.
\( ^{13} \) M. Järvinen, M. Merisalo, A. Pesonen, and O. Inkinen, J. Appl. Crystallogr. 3, 313 (1970).
\( ^{14} \) F. A. Wedgwood, J. Phys. C 5, 2427 (1972).
\( ^{15} \) W. Suski, T. Palewski, and T. Mydlarz, Int. J. Magn. 4, 305 (1973); and private communication.
\( ^{16} \) W. E. Gardner and T. F. Smith, Proceedings of the
Eleventh International Conference on Low Temperature Physics, edited by J. F. Allen, D. M. Finlayson, and D. M. McCall (University of St. Andrews, St. Andrews, Scotland, 1969), Vol. 2, p. 1377.
\( ^{17} \) J. A. C. Marples, J. Phys. Chem. Solids 31, 2431 (1970).
\( ^{18} \) R. M. Moon, W. C. Koehler, J. W. Cable, and H. R. Child, Phys. Rev. B 5, 997 (1972).
\( ^{19} \) K. J. Duff and T. P. Das, Phys. Rev. B 3, 2294 (1971).
\( ^{20} \) W. Marshall and S. W. Lovesey, Theory of Thermal Neutron Scattering (Oxford U. P., London, 1971), p. 181.
\( ^{21} \) G. H. Lander, B. D. Dunlap, M. H. Mueller, I. Nowik, and J. F. Reddy, Intl. J. Magn. 4, 99 (1973), and references therein.
\( ^{22} \) S. Chikazumi and S. H. Charap, Physics of Magnetism (Wiley, New York, 1964), p. 251.
\( ^{23} \) A. Oppelt and K. H. J. Buschow, J. Phys. F 3, L212 (1973).
\( ^{24} \) K. N. R. Taylor, Adv. Phys. 20, 551 (1971).
\( ^{25} \) A. T. Aldred, B. D. Dunlap, A. R. Harvey, D. J. Lam, G. H. Lander, and M. H. Mueller, Phys. Rev. B 9, 3766 (1974).
\( ^{26} \) A. E. Clark, AIP Conf. Proc. 18, 1015 (1974).
\( ^{27} \) G. J. Bowden, D. St. P. Bunbury, A. P. Guimaraes, and R. E. Snyder, J. Phys. C 1, 1376 (1968).
\( ^{28} \) N. Kaplan, E. Dormann, K. H. J. Buschow, and D. Lebenbaum, Phys. Rev. B 7, 40 (1973).
\( ^{29} \) H. W. de Wijn, A. M. van Diepen, and K. H. J. Buschow, Phys. Rev. B 7, 524 (1973).
\( ^{30} \) K. K. Murata and S. Doniach, Phys. Rev. Lett. 29, 285 (1972).
 p10_0.jpg
 p10_1.jpg
 p11_0.jpg
 p11_1.jpg
 p12_0.jpg
 p13_0.jpg
 p2_0.jpg
 p3_0.jpg
 p4_0.jpg
 p4_1.jpg
 p5_0.jpg
 p6_0.jpg
 p8_0.jpg
 p9_0.jpg
 p9_1.jpg